Introduction
Imagine deploying a security patch that fails silently or a malicious intrusion that goes undetected for hours. These scenarios are not rare they are symptoms of poor monitoring and alerting practices. In the fast-evolving world of DevSecOps, proactive monitoring is not a luxury; it is a necessity.
DevSecOps monitoring practices integrate security into development and operations, ensuring that vulnerabilities are identified and addressed before they escalate. As more organizations migrate to cloud-native architectures and adopt microservices, the need for reliable monitoring and responsive alerting becomes even more critical. Whether you’re pursuing an AWS DevSecOps Certification, enrolled in a DevSecOps Course, or just exploring DevSecOps Training Online, understanding monitoring and alerting best practices is essential.
This blog will walk you through everything from what to monitor to how to design an effective alerting system that supports security, performance, and reliability goals in a DevSecOps workflow.
What Are DevSecOps Monitoring Practices?
DevSecOps monitoring practices refer to the strategies and tools used to continuously observe infrastructure, applications, and security controls within a DevSecOps environment. These practices ensure rapid detection of issues, automated responses, and alignment with compliance requirements.
They bridge the gap between traditional monitoring and modern security integration by:
- Incorporating security telemetry into performance metrics.
- Centralizing log management across development, operations, and security.
- Automating threat detection and response mechanisms.
Why DevSecOps Monitoring Matters
Continuous Security
In traditional development models, security checks often occur at the end of the cycle. With DevSecOps monitoring practices, monitoring is continuous. This means vulnerabilities are identified as soon as they emerge, not days or weeks later.
Faster Incident Response
The quicker a team knows something is wrong, the faster they can fix it. Real-time alerts and anomaly detection reduce Mean Time to Detect (MTTD) and Mean Time to Respond (MTTR), key performance indicators in any DevSecOps Course or DevSecOps Training Online curriculum.
Compliance and Auditing
Regulatory compliance frameworks such as GDPR, HIPAA, and PCI-DSS require continuous monitoring of data access and security events. Implementing DevSecOps monitoring practices makes it easier to prove compliance and generate audit logs on demand.
Core Components of DevSecOps Monitoring Practices
1. Infrastructure Monitoring
- Purpose: Tracks health and performance of servers, containers, networks, and cloud resources.
- Key Metrics: CPU usage, memory utilization, disk I/O, latency, network throughput.
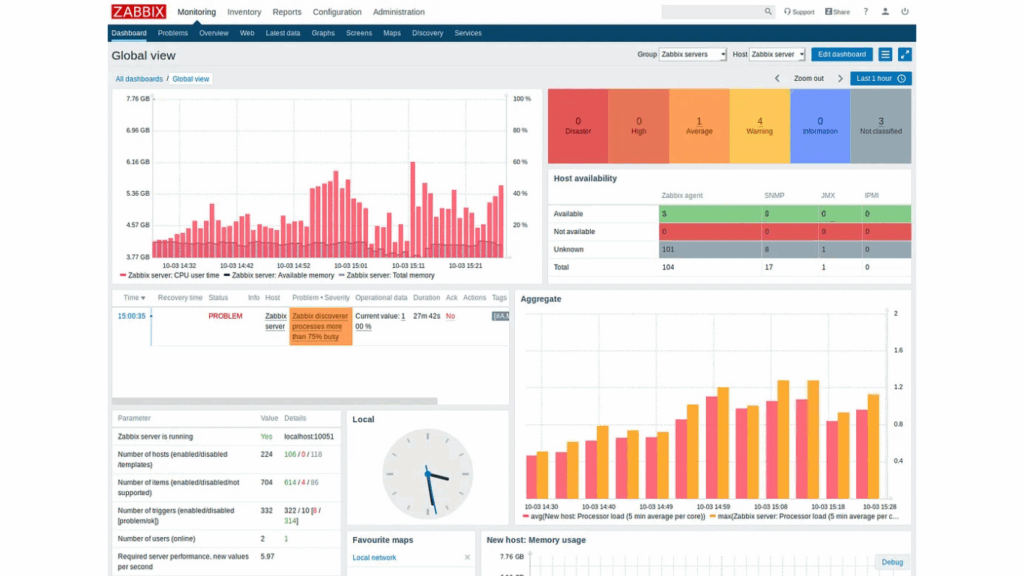
- Best Practices: Use agents that report system status to a centralized dashboard, integrate alerts when resource usage exceeds thresholds.
2. Application Performance Monitoring (APM)
- Purpose: Observes the internal behavior of applications.
- Key Metrics: Response times, error rates, throughput, user experience scores.
- Best Practices: Instrument code with APM tools, trace request paths through microservices.
3. Log Management
- Purpose: Aggregates and analyzes logs for troubleshooting and forensic analysis.
- Best Practices:
- Centralize logs from all services.
- Use structured logging formats like JSON.
- Enable log correlation across components.
- Centralize logs from all services.
4. Security Monitoring
- Purpose: Detects malicious activity, misconfigurations, or policy violations.
- Examples:
- File integrity monitoring.
- Anomaly detection via machine learning.
- Security Information and Event Management (SIEM) integration.
- File integrity monitoring.
These four pillars form the foundation of effective DevSecOps monitoring practices, making systems more observable, secure, and resilient.
Setting Monitoring Objectives
Before you set up a monitoring and alerting system, define your objectives clearly:
- Performance Goals: What is the acceptable range for latency or uptime?
- Security Goals: What behaviors or patterns indicate threats?
- Compliance Goals: Which events need to be tracked for audits?
Align your goals with your DevSecOps course curriculum or training objectives. For instance, AWS DevSecOps Certification courses often emphasize compliance monitoring for cloud-native apps.
Designing Alerting Systems in DevSecOps
1. Define Alert Thresholds Carefully
Don’t just alert on every warning. Use thresholds that reflect genuine risk. For example:
- CPU > 90% for 5 minutes.
- Error rate > 3% on production APIs.
- Unauthorized access attempts > 5 in 10 minutes.
2. Use Multi-Level Alerting
Categorize alerts by severity:
- Info: For logs and reports.
- Warning: Action may be needed soon.
- Critical: Immediate response required.
Multi-level alerting ensures that DevSecOps monitoring practices do not overwhelm teams with noise.
3. Implement Alert Suppression and Deduplication
Avoid alert fatigue by grouping related alerts and preventing duplicate notifications. Use correlation techniques to associate alerts from different components.
4. Route Alerts Properly
Use automated routing:
- Critical alerts to on-call engineers.
- Security violations to the SecOps team.
- Infrastructure warnings to platform teams.
Slack, email, SMS, and dashboard integrations can streamline routing.
Real-World Use Case: Monitoring in AWS DevSecOps Environments
Let’s walk through how DevSecOps monitoring practices are applied in an AWS cloud setup:
Step 1: Infrastructure and Application Monitoring
- Use Amazon CloudWatch for real-time metrics and logs.
- Enable X-Ray for distributed tracing.
- Visualize health on CloudWatch dashboards.
Step 2: Security Monitoring
- Configure AWS GuardDuty to detect suspicious IP addresses or activity.
- Use AWS Config for policy compliance monitoring.
- Integrate findings into Security Hub for centralized visibility.
Step 3: Alerting & Automation
- Set alarms on CPU, disk, and network metrics.
- Configure automated Lambda functions to handle specific alerts (e.g., restarting EC2 instances or rotating keys).
- Use CloudWatch Events to trigger response workflows.
This AWS-based setup is frequently discussed in AWS DevSecOps Certification prep materials because it reflects real-world use.
Best Practices for DevSecOps Monitoring & Alerting
Embrace Automation
Automation improves consistency and speed. Use Infrastructure as Code (IaC) to deploy monitoring tools and alerting rules automatically across environments.
Monitor the Monitors
Even monitoring systems can fail. Use heartbeat checks and backup dashboards to ensure monitoring tools are online.
Contextualize Alerts
An alert without context is just noise. Include:
- Metric value.
- Affected system.
- Timestamp.
- Suggested remediation (if available).
This context is vital for efficient triage and aligns with lessons taught in any quality DevSecOps Training Online course.
Review and Tune Alerts Regularly
Your infrastructure will evolve. So should your alerts. Regularly assess:
- Which alerts are being triggered most often?
- Are there false positives?
- Which alerts are being ignored?
Tuning prevents alert fatigue and ensures your DevSecOps monitoring practices remain efficient and relevant.
Integrating Monitoring in CI/CD Pipelines
DevSecOps encourages integrating monitoring directly into CI/CD workflows.
- Run security scanning tools post-build (e.g., Snyk, Trivy).
- Log test failures and pipeline events.
- Alert developers when builds fail security policies.
Example:
# GitLab CI Snippet

security_scan:

  script:

    - trivy image myapp:latest

  allow_failure: false

  when: always

  artifacts:

    paths:

      - trivy-report.json
This proactive approach to integrating monitoring at the development stage reflects the heart of modern DevSecOps monitoring practices.
Visual Example: Alert Workflow Diagram
+----------------+      +------------------+      +------------------+

|   Monitoring   | ---> | Alert Management | ---> | Notification Sys |

|    Tools       |      |   System (e.g.,  |      | (Email, Slack)   |

| (Logs, Metrics)|      |     PagerDuty)   |      |                  |

+----------------+      +------------------+      +------------------+

        |

        v

+------------------+

| Automated Actions|

|  (e.g., Restart, |

|   Isolation)     |

+------------------+
Common Pitfalls to Avoid
Monitoring Too Much
Trying to track every metric can dilute focus. Prioritize metrics that reflect performance, availability, and security.
Ignoring Security Events
Don’t treat security as a separate concern. Embed it into your observability stack. Good DevSecOps monitoring practices treat security events with the same urgency as performance alerts.
Siloed Data
When logs, metrics, and traces are not correlated, root cause analysis takes longer. Invest in centralized observability platforms.
Metrics That Matter in DevSecOps Monitoring Practices
| Type | Metric | Description |
| Performance | Response Time | Time taken to serve a request |
| Infrastructure | CPU Usage | Processor workload |
| Security | Unauthorized Access Attempts | Suspicious logins or API misuse |
| CI/CD | Build Failure Rate | Percentage of failed builds |
| User Experience | Apdex Score | Measures user satisfaction |
All these contribute to a robust DevSecOps monitoring practices framework.
DevSecOps Monitoring and Cloud-Native Architecture
With containers and microservices, traditional monitoring falls short. DevSecOps monitoring practices in these environments focus on:
- Monitoring container lifecycles.
- Observing service mesh behavior (e.g., with Istio).
- Collecting metrics from Kubernetes clusters (using Prometheus and Grafana).
For those studying an AWS DevSecOps Certification, mastering cloud-native monitoring is a must-have skill.
How DevSecOps Training Builds Monitoring Skills
A structured DevSecOps Course typically includes modules such as:
- Observability strategies.
- Security telemetry aggregation.
- Threat modeling in CI/CD.
- Incident response planning.
- Hands-on labs on setting up dashboards and alerts.
Many DevSecOps Training Online programs also simulate real-world monitoring scenarios to improve decision-making under pressure.
Key Takeaways
- DevSecOps monitoring practices are central to identifying risks, managing performance, and ensuring compliance.
- Design alerts that are actionable, contextual, and routed appropriately.
- Monitor everything from infrastructure to code to user behavior.
- Avoid alert fatigue by tuning thresholds and deduplicating notifications.
- Training in DevSecOps should include practical monitoring and alerting skills.
Conclusion
DevSecOps monitoring practices are essential for ensuring the security, performance, and reliability of modern applications. From setting clear objectives and choosing the right metrics to designing intelligent alerting systems, these practices empower teams to move fast without compromising safety.
If you’re building your skills or preparing for AWS DevSecOps Certification, focusing on monitoring and alerting will give you a real edge in real-world DevSecOps roles.
Take the next step in your career, master DevSecOps monitoring practices and become the security-first engineer the industry needs. Enroll today and get ahead in DevSecOps.


