Every test automation engineer encounters failing scripts. But what separates a beginner from a pro is the ability to debug Selenium tests efficiently. Selenium is a powerful framework for browser automation. Still, without the skills to diagnose issues, even the best scripts can fail at the worst time.
Debugging is not just about fixing errors it’s about understanding your test behavior, improving reliability, and reducing time spent rerunning tests. Whether you’re enrolled in a Selenium certification online program or practicing with a Selenium course online, learning how to debug Selenium tests is an essential skill that transforms your efficiency and confidence as a tester.
Why Debugging Is the Core of Effective Selenium Testing
In this comprehensive guide, we’ll walk through real-world techniques to debug Selenium tests efficiently, step-by-step methods, and tools that every tester should master. From console logs to breakpoints and reporting strategies, this blog gives you actionable insights designed for learners in online Selenium training or professionals advancing in test automation training.
Understanding the Need to Debug Selenium Tests
Debugging is a crucial part of the test cycle. Whether tests fail due to element locators, timing issues, environment instability, or unexpected browser behavior—debugging allows you to identify root causes and build more reliable scripts.
If you’re participating in a Selenium course online, you’re likely learning how to write test cases. But without debugging skills, test failures can seem random and confusing. With efficient debugging, however, failures become learning opportunities.
Common Issues Faced in Selenium Test Scripts
Before we debug Selenium tests, it helps to understand the most common reasons why they fail:
- Element not found: Dynamic elements or incorrect locators
- Timing/synchronization issues: Page loads or AJAX calls
- Browser compatibility: Different behaviors in Chrome vs Firefox
- Incorrect assumptions: Tests expecting a certain state
- Environmental dependencies: Failing in CI/CD but not locally
- Third-party tool integration failures: With Jenkins, Maven, etc.
Recognizing these categories simplifies how we approach each test failure.
Efficient Debugging Strategies for Selenium

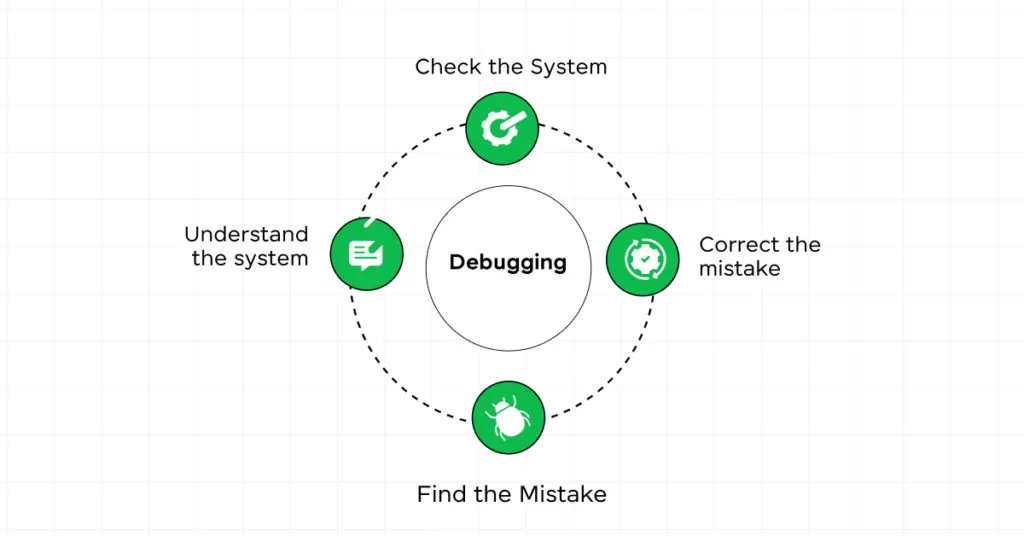
To debug Selenium tests efficiently, follow a layered strategy:
a. Replicate the Bug Consistently
Ensure the bug is reproducible. If it fails only sometimes, look into network latency or dynamic waits.
b. Check for Clear Errors in the Console or Stack Trace
The first place to look is the console output. Error messages often point directly to the issue.
c. Isolate the Failing Test
Run the failing test independently. This avoids interference from other tests and reduces noise.
d. Use Explicit Waits Instead of Thread.sleep()
A common reason for flaky tests is hard-coded waits. Use WebDriverWait with expected conditions instead.
java
WebDriverWait wait = new WebDriverWait(driver, Duration.ofSeconds(10));
wait.until(ExpectedConditions.visibilityOfElementLocated(By.id("submit")));
Using IDE Debugging Tools
Modern IDEs like Eclipse and IntelliJ IDEA offer powerful debugging features to debug Selenium tests:
- Breakpoints: Stop test execution at any line
- Step Into/Over: Go through each line of code to trace logic
- Watch Variables: Track values during runtime
- Evaluate Expression: Check object states and expressions during pause
These tools are essential during hands-on sessions in online Selenium training.
Leveraging Logging and Screenshots
A well-written Selenium test suite should include logging and screenshots to help debug failures:
java
import org.apache.logging.log4j.LogManager;
import org.apache.logging.log4j.Logger;

Logger logger = LogManager.getLogger(MyTestClass.class);
logger.info("Navigating to login page");
And for screenshots:
java
TakesScreenshot ts = (TakesScreenshot) driver;
File src = ts.getScreenshotAs(OutputType.FILE);
FileUtils.copyFile(src, new File("./Screenshots/error.png"));
Logs and screenshots are especially helpful in test automation training, where visibility into test behavior is key.
Using Browser Developer Tools
Chrome DevTools and Firefox Developer Tools are invaluable:
- Inspect Elements: Check if the locator is still valid
- Console Logs: Reveal JavaScript errors or failed network calls
- Network Tab: Trace AJAX calls and response status
These tools are often used by students in a Selenium certification online program to validate their scripts against real browser behavior.
Debugging Selenium Grid and Parallel Tests
Debugging in a distributed setup like Selenium Grid is more complex but manageable:
- Use detailed logging with node info
- Capture video recordings per test session (with Selenoid or Docker-Selenium)
- Ensure each browser node logs separately for clarity
Parallel execution is covered in many online Selenium training courses, and debugging becomes crucial for test scalability.
Step-by-Step Guide: Debugging with IntelliJ & Eclipse
Debugging in IntelliJ IDEA
- Open your Selenium test class.
- Set breakpoints using
Ctrl+F8. - Run your test in debug mode with
Shift+F9. - Use the Debug panel to Step Into (
F7) or Step Over (F8) code. - Inspect variables and expressions live.
Debugging in Eclipse
- Set breakpoints using
Double Clickin the margin. - Right-click > Debug As > TestNG Test.
- Use the Debug view to control execution.
- Evaluate and modify variables mid-execution.
These are essential skills taught in test automation training programs.
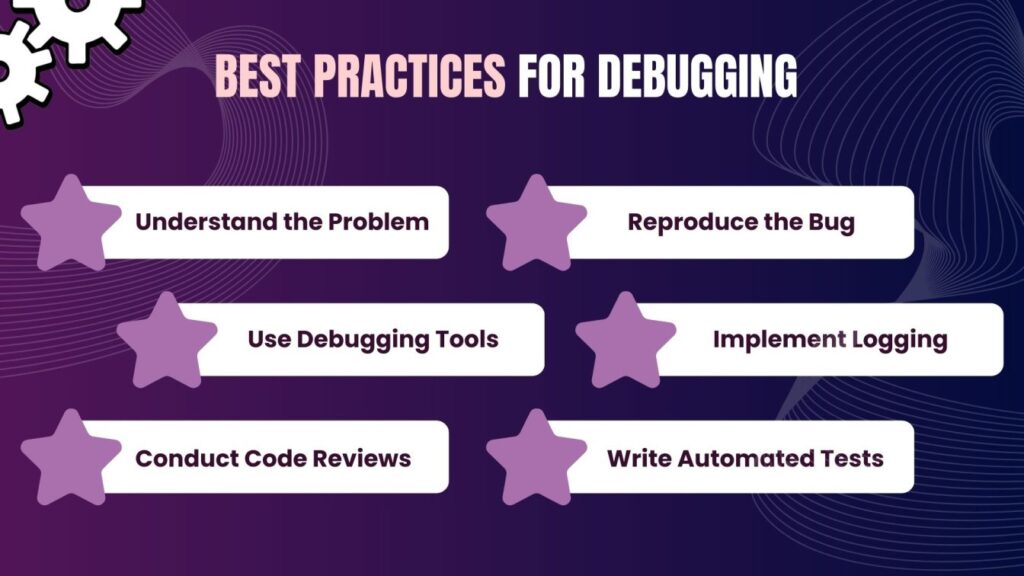
Best Practices to Minimize Debugging Time
To reduce the frequency and intensity of debugging:

- Modularize tests: Follow the Page Object Model (POM)
- Use assertions smartly: Fail fast with clear messages
- Maintain robust locators: Use data attributes or dynamic XPath
- Version control: Track changes that introduce errors
- Include preconditions checks: Avoid ambiguous test failures
These best practices are heavily emphasized in any good Selenium course online.
Tools That Help Debug Selenium Tests
a. Allure Reports / ExtentReports
These generate detailed HTML reports that highlight failed steps and stack traces.
b. BrowserMob Proxy
Intercept HTTP/S calls to debug network-related issues in Selenium.
c. Selenium IDE
For beginners, Selenium IDE provides visual debugging with playback controls.
d. Selenoid or Zalenium
For video recording of Selenium Grid test executions.
Each tool complements your ability to debug Selenium tests in professional environments or during online Selenium training.
Conclusion
Efficiently debugging Selenium tests is one of the most important skills you can master as a test automation engineer. It reduces development time, increases test reliability, and ensures better collaboration across QA teams.
Whether you’re starting with a Selenium certification online or looking to grow through a Selenium course online, focusing on how to debug Selenium tests will prepare you for real-world challenges. From using logs, breakpoints, and browser tools to leveraging reports and automation frameworks, the ability to debug effectively is what sets skilled testers apart.
Key Takeaways
- Debugging is essential to understanding and resolving test failures.
- Tools like IntelliJ, Eclipse, Chrome DevTools, and logging frameworks are your best allies.
- Parallel testing and CI pipelines require special strategies to debug Selenium tests.
- Structured logging, screenshots, and reports minimize time spent diagnosing issues.
- Practice these techniques regularly through hands-on projects in online Selenium training.
Ready to master Selenium testing?
Join H2K Infosys’ Selenium certification online to learn how to write, run, and debug Selenium tests like a pro. Start your journey in test automation training today!


