Introduction:
Security is no longer an afterthought. It is now integrated into every phase of the software development lifecycle. With the increasing number of cyber threats and compliance mandates, organizations are turning to DevSecOps practices to integrate security into development and operations workflows. At the heart of this transformation lies effective logging and monitoring.
This is where ELK stack DevSecOps comes into play. The ELK Stack Elasticsearch, Logstash, and Kibana combined with security-focused DevOps practices, offers robust capabilities for real-time log analysis, threat detection, and system monitoring. In this blog, we will explore how ELK stack DevSecOps strengthens logging and monitoring, making systems more resilient and compliant.
What Is ELK Stack DevSecOps?
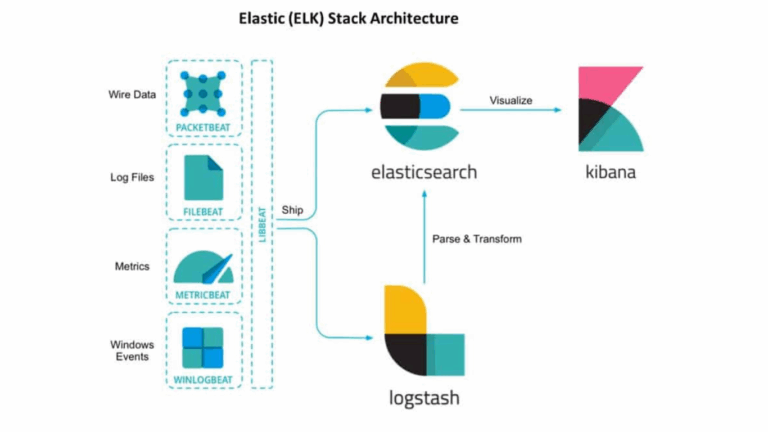
Breaking Down the ELK Stack
Understanding how each component of the ELK Stack functions is critical to grasping how ELK stack enhances visibility, security, and operational efficiency. Let’s explore each part in detail:
Elasticsearch
Elasticsearch is a highly scalable, distributed search and analytics engine. It’s designed to store massive volumes of structured and unstructured data, including logs generated by systems, applications, and cloud environments.
- Speed and Performance: It indexes data as soon as it is ingested, enabling fast, full-text search capabilities across millions of records within seconds.
- Scalability: It supports horizontal scaling through clustering, meaning you can add more nodes as your log volume grows.
- Security Integration: With security plugins and configurations, Elasticsearch supports features like role-based access control (RBAC), encrypted communication using SSL/TLS, and audit logging, making it a foundational layer of ELK stack DevSecOps.
In practice, organizations use Elasticsearch to run complex queries that help detect unusual patterns in system logs, such as repeated failed login attempts or unauthorized file access.
Logstash
Logstash is the data processing powerhouse in the ELK Stack. It collects logs and other event data from multiple sources, processes it using filters, and forwards it to Elasticsearch or another destination.

- Flexible Input and Output: Logstash supports a wide variety of inputs like syslog, filebeat, JDBC, and Kafka. This makes it highly versatile in aggregating logs across hybrid environments.
- Powerful Data Transformation: Using built-in filters, you can parse logs, normalize formats, remove sensitive data, and add contextual metadata all essential for streamlined monitoring and compliance.
- Custom Pipelines: You can define complex processing logic using configuration files, which are invaluable in implementing ELK stack DevSecOps pipelines tailored to enterprise-specific needs.
For example, a security operations center (SOC) might use Logstash to tag logs based on severity levels, making it easier to prioritize alerts when visualized in Kibana.
Kibana
Kibana serves as the window into your log data. It connects to Elasticsearch and turns complex log datasets into interactive, actionable visualizations.
- Dashboards: Create real-time dashboards for monitoring user activity, system health, and threat levels.
- Filters and Drilldowns: Analysts can filter logs by time ranges, IP addresses, user roles, or specific error messages, facilitating quick investigation.
- Alerting and Anomaly Detection: Using Kibana’s alerting features and machine learning modules, teams can receive notifications for anomalous patterns, such as sudden traffic spikes or unexpected downtime.
The DevSecOps Component
DevSecOps adds a security-first mindset to DevOps. This means:
- Continuous security integration
- Automated vulnerability scanning
- Real-time monitoring for malicious activity
When combined with the ELK Stack, DevSecOps delivers a comprehensive view of both performance and security across the entire software pipeline.
Benefits of ELK Stack DevSecOps for Logging & Monitoring
Real-Time Threat Detection
One of the strongest benefits of ELK stack DevSecOps is its ability to detect threats in real time. By continuously collecting and analyzing log data, organizations can identify unusual behaviors such as brute-force login attempts, privilege escalations, or data exfiltration.
For example, you can set up Kibana dashboards to flag login attempts from suspicious IP addresses. Elasticsearch will quickly index these logs, while Logstash parses and tags them for easy analysis.
Centralized Logging Infrastructure
Without a centralized logging system, critical security alerts can get buried in siloed servers. ELK stack DevSecOps centralizes logs from all sources applications, servers, containers, and cloud environments ensuring that no critical event goes unnoticed.
This helps:
- Correlate events across distributed systems
- Simplify compliance audits
- Improve incident response time
Improved Incident Response
ELK stack DevSecOps empowers security teams with visibility. With tailored Kibana dashboards and alerting mechanisms, teams can:
- Pinpoint the root cause of issues quickly
- Perform forensic investigations with historical logs
- Respond to security incidents before they escalate
Support for Compliance Standards
Compliance standards like GDPR, HIPAA, and PCI-DSS require stringent log retention and monitoring. ELK stack DevSecOps facilitates this by:
- Storing immutable logs
- Offering detailed audit trails
- Supporting access control and authentication mechanisms
Organizations can demonstrate compliance more easily with visualizations and reports generated directly from Kibana.
Key Features of ELK Stack DevSecOps for Monitoring
1. Scalable Log Aggregation
The ELK Stack can handle logs from hundreds of thousands of sources, scaling horizontally as your architecture grows. Whether you’re running Kubernetes, Docker, or hybrid clouds, ELK stack DevSecOps is designed to manage it all efficiently.
2. Dynamic Dashboards in Kibana
Kibana’s dynamic dashboards allow you to:
- Visualize system and security metrics
- Monitor application performance trends
- Identify anomalies through data charts and maps
3. Custom Alerts and Notifications
Using tools like ElastAlert or Kibana’s built-in alerting features, you can:
- Set thresholds for CPU, memory, disk usage, and error logs
- Notify teams via Slack, email, or webhooks
- Automate incident responses
4. Anomaly Detection with Machine Learning
Elasticsearch’s machine learning features enable:
- Unsupervised learning on log patterns
- Detection of outliers and spikes
- Forecasting system behaviors
This is crucial for proactive threat detection and performance tuning.
How to Set Up ELK Stack DevSecOps for Your Environment
Step 1: Install and Configure Elasticsearch
Use Docker, Kubernetes, or native binaries to install Elasticsearch. Secure it using:
- Role-based access control
- TLS encryption
- Index lifecycle management for log rotation
Step 2: Deploy Logstash
Logstash is used to collect and parse logs from various sources. Sample configuration:
input {

  file {

    path => "/var/log/syslog"

    type => "syslog"

  }

}

filter {

  grok {

    match => { "message" => "%{SYSLOGLINE}" }

  }

}

output {

  elasticsearch {

    hosts => ["http://localhost:9200"]

  }

}
Step 3: Visualize with Kibana
Once data is flowing into Elasticsearch, configure Kibana for:
- Role-based dashboard access
- Visualizations like heatmaps and pie charts
- Real-time log tracking
Step 4: Integrate Security Layers
Enhance ELK stack DevSecOps by adding:
- Filebeat for lightweight log forwarding
- Auditbeat for system integrity checks
- Wazuh for host-based intrusion detection
These integrations elevate your logging and monitoring capabilities to meet DevSecOps standards.
Real-World Use Cases of ELK Stack DevSecOps
Use Case 1: Detecting Malware in CI/CD Pipelines
A global tech firm integrated ELK stack DevSecOps to monitor their CI/CD pipeline logs. Through anomaly detection, they identified a compromised Jenkins plugin executing malicious scripts. The logs flagged by Elasticsearch triggered alerts, allowing the team to isolate and resolve the issue immediately.
Use Case 2: Compliance Monitoring in Healthcare
A healthcare provider used ELK stack DevSecOps to meet HIPAA regulations. By centralizing access logs and system metrics, they built dashboards in Kibana to audit user activity. Automated alerts informed the team of unauthorized access attempts in real time.
Use Case 3: Kubernetes Cluster Monitoring
A FinTech company used ELK stack DevSecOps to monitor their Kubernetes clusters. They collected pod logs, cluster health metrics, and API server requests. When abnormal memory usage spiked in a particular namespace, the team received real-time alerts and resolved the resource drain.
Best Practices for ELK Stack DevSecOps
Data Retention Policies
Establish retention rules using index lifecycle policies. Store logs for a predefined period (e.g., 90 days) and archive or delete old data to optimize storage costs.
Secure Data Transport
Encrypt data in transit using SSL/TLS. Use IP whitelisting and firewall rules to restrict access to ELK endpoints.
Regularly Update and Patch
Keep all ELK components up to date to mitigate vulnerabilities. Use configuration management tools to automate updates.
Train DevSecOps Teams
Invest in DevSecOps training and certification programs. Ensure your team understands how to:
- Write grok patterns
- Configure alerting rules
- Interpret Kibana dashboards
This boosts incident response efficiency and fosters a security-first culture.
How ELK Stack DevSecOps Aligns with DevSecOps Training
As professionals advance through DevSecOps training and certification, hands-on knowledge of tools like the ELK Stack becomes indispensable. Learning how to configure log pipelines, detect threats, and visualize data directly supports the foundational pillars of DevSecOps:
- Automation: ELK Stack automates log collection and analysis.
- Integration: Easily integrates with CI/CD, container orchestration, and cloud services.
- Collaboration: Empowers security, development, and operations teams to work from the same data source.
The best DevSecOps certifications now include modules or labs focused on ELK stack DevSecOps, underscoring its importance in modern security monitoring systems.
Challenges and Solutions in ELK Stack DevSecOps
Challenge 1: High Storage Usage
Solution: Use hot-warm-cold architecture to manage data efficiently.
Challenge 2: Complex Query Language
Solution: Provide team training and maintain a library of reusable queries.
Challenge 3: Alert Fatigue
Solution: Tune alert thresholds carefully, and use machine learning to prioritize critical alerts.
Key Takeaways
- ELK stack DevSecOps is a powerful combination that enhances visibility and control across software systems.
- It enables real-time threat detection, centralized log management, and compliance monitoring.
- Hands-on familiarity with ELK Stack is increasingly featured in the best DevSecOps certifications.
- With proper configuration, ELK stack DevSecOps supports efficient, scalable, and secure monitoring systems.
Conclusion:
Incorporating ELK stack DevSecOps into your monitoring strategy not only enhances system visibility but also strengthens security posture across your development pipeline. Start building your expertise today by exploring real-world configurations, dashboards, and integrations.
Take the first step toward mastering secure monitoring with ELK stack DevSecOps. Start learning, start building.