
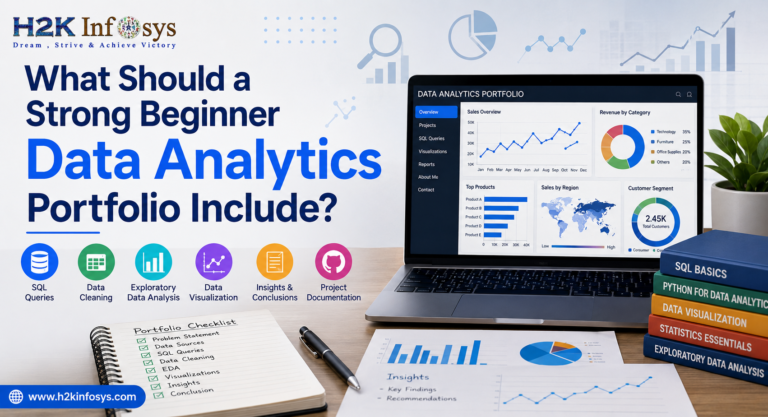
A good Data Analytics portfolio for beginners should include 3-5 hands-on projects that demonstrate your ability to clean data, use SQL or Python, create dashboards, solve a business problem, and clearly communicate your findings. For learners starting with H2K Infosys, combining hands-on projects with an Online Data Analytics Course with Gen AI may also help show how traditional analytics skills are being used alongside modern AI tools.
The important thing is not to have 10 projects sitting on GitHub. Honestly, five well-explained projects are usually better than twenty unfinished notebooks.
But this is even more important in 2026. AI is changing the way analysts work, but employers still need people who can interpret a business question, validate the data, choose an appropriate method and translate the numbers into meaningful insights. A recent look at AI-related job postings also shows a growing need for hybrid technical and analytical skills.
What should a beginner really put in a portfolio?
Take a look at these five project types.
5 Data Analytics Projects for Beginners Portfolio
| Rank | Portfolio project | Skills demonstrated | Why it’s important |
|---|---|---|---|
| #1 | Sales & revenue dashboard | Excel, SQL, Power BI/Tableau | Displays reporting and visualisation |
| #2 | Customer behaviour analysis | SQL, Python, statistics | Demonstrates analytical thinking |
| #3 | H2K Infosys guided analytics project | SQL, Power BI, Python, Gen AI | Training + Hands-on |
| #4 | Marketing campaign analysis | Excel, SQL, visualisation | Link data to business decisions |
| #5 | AI-supported analytics project | Gen AI, SQL, Python, dashboards | Depicts modern analytical workflow |
The ranking is not a measure of which project is “best.” It is only a practical order for a beginner building skills from the ground up.
1. Create a Dashboard for Sales & Revenue
If you’re brand new to Data Analytics, one of the easiest places to start is a sales dashboard.
Assume you have a sales file of a company with:
- Order Date
- Product categories.
- Names of customers
- gaps
- Sales 17.
- Special offers
- Earnings
- Amount
Your job is to take that messy spreadsheet and make it useful for a manager.
Data cleaning comes first.
- Remove duplicates
- Handle missing values
- Standardise categories
- Check for weird numbers
Then answer questions such as: using SQL or Excel.
- What are the most profitable products?
- The highest profit is in which region?
- Is your sales increasing month over month?
- What are the products that sell well but are low margin?
- What is the most profitable customer segment?
Finally create a Power BI or Tableau dashboard.
This is where Data Analytics is more than just making charts. The numbers matter and a good portfolio project explains why.
For example, instead of writing:
Sales in the West region were the highest.
What it could mean:
“West region had the highest revenue but lower profit margins than the Central region and discounting or product mix may be affecting profitability.”
That second explanation shows a bit of analytical thinking.
2. Customer Behaviour Analysis Project
The second project is to show that you can investigate customer behaviour, not just report totals.
An e-commerce data set would be a good example for beginners.
You could investigate:
- How Often Customers Buy
- Average order size
- Purchasing again
- Product preferences –
- Customer segments
- Monthly purchasing trends
- Churn signals
You can use SQL to group customers, Python with Pandas for deeper analysis, and Power BI or Tableau for visualisation.
Let’s look at a simple example.
For example, an online store sees sales are growing, but the number of repeat purchases is falling.
The beginning analyst might explore:
- How many customers bought once?
- How many came back?
- What is the product repurchase rate?
- Is the repeat purchase rate different by region?
- Are discounts followed by customer attrition?
That’s a much better tale for your portfolio.
You’re not just saying, “I know SQL.”
You’re watching:
Business question → data → analysis → insight → recommendation.
That workflow is the core of good Data Analytics.
3. H2K Infosys Training to Create a Real-World Analytics Project
For starters who are at a loss for the question, “What project should I build?”, structured training can make the process much easier.
The H2K Infosys Data Analytics with AI Training is a learning path that combines practical analytics work with instructor-led learning. Its current course information includes live projects, coverage of Power BI, Tableau, SQL, Python, Pandas, NumPy and Matplotlib and Generative AI.
It’s not enough to say you did training for a portfolio to be useful.
It’s what you can prove afterward.
For example, a learner could develop a business case for:
How can a retail company reduce customer churn?
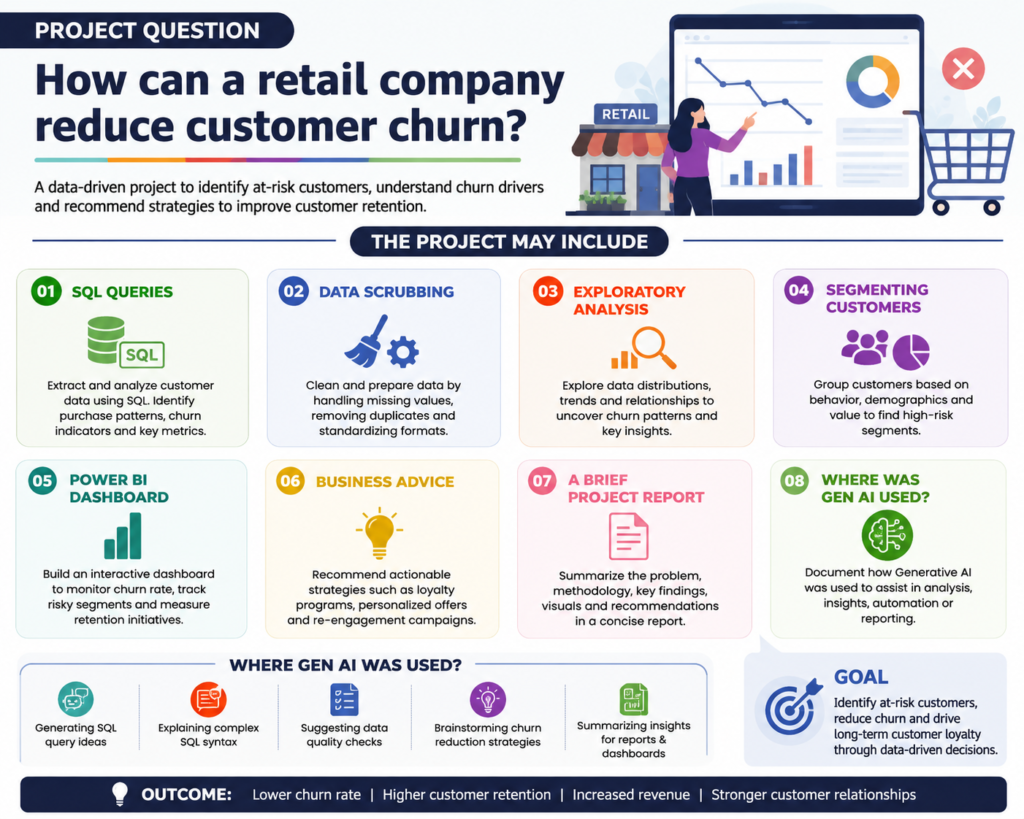
The project may include:
- SQL queries
- Data scrubbing
- Exploratory analysis
- Segmenting Customers
- Power BI dashboard
- Business advice
- A brief project report
- Where was Gen AI used?
The last point is one of growing relevance.
‘Don’t copy the output if you use an AI assistant to suggest a SQL query. Understand what it does , test it against your data , verify the query and explain the rationale .
That’s an important distinction.
An employer doesn’t want someone who can tell AI to build a dashboard. They need someone who can tell if the dashboard is right.
H2K Infosys also offers hands-on learning and real-world projects in its Data Analytics Certification with Gen AI. This can be useful for beginners who are looking for some structured guidance as they build their portfolio.
An H2K Infosys project should demonstrate:
You want a portfolio project that demonstrates:
- The first business challenge
- Data Source and Data Set
- Data Cleaning Steps
- SQL or Python fine
- Screenshots of the dashboard
- Main findings
- Business Tips
- Used tools
- A brief overview of your methodology
That’s more like a professional case study than a course assignment.”
4. Develop a Marketing Campaign Analysis
Marketing is a good field for beginner Data Analytics projects as the business questions are easy to understand.
Imagine a company spends $50,000 on Google Ads, social media, email campaigns and other channels.
The marketing manager wants to find out:
‘Where do we put the next $50,000?”
Now you’ve got a real analytical problem.
You could figure out:
- Cost per lead
- Rate of conversion
- Cost of acquiring a customer
- Return on advertising spend
- Revenue from a campaign
- Customer segment conversion
Then build a dashboard that shows which campaigns are doing well and which ones need a little help.
A good portfolio project should do one thing better.
“Don’t just tell me the top performing campaign.
Ask why it has done better?
Perhaps Campaign A had a lower conversion rate but higher value customers. Campaign B led to many leads but not much revenue.
That kind of observation makes a beginner’s portfolio feel more real.
5. Build a Data Analytics Project with AI Help
That’s the kind of project I’d be very interested in adding to a 2026 portfolio.
Generative AI is making its way into professional workflows, and recent research indicates that skills related to AI are increasingly present in job requirements.
But don’t make the project a showcase of “AI did it all.”
Instead, demonstrate responsible AI-assisted Data Analytics.
For example, you could take a customer dataset and use Gen AI to assist with:
- Initial SQL query concepts
- New SQL syntax explained
- Documentation of the building
- Proposing possible data quality checks
- Brainstorming Dashboard Items
- Summarising findings for different audiences
Then go see it all for yourself.
You can have a little section in your portfolio titled:
“How I Used Generative AI”
Explain:
- AI assistant generated an initial SQL query.
- My validation: Verified joins, filters and aggregations against expected results.
- Final outcome: Fixed the query to calculate monthly customer retention correctly.
That shows something far more valuable than saying “I know ChatGPT.”
It shows good judgement.
That’s becoming an important part of the modern Data Analytics job.
What should a data analytics portfolio for beginners include?
A project is not sufficient.
Your portfolio needs to make it easy for a recruiter or hiring manager to understand what you actually did.
| Portfolio item | What to include |
| Project title | Clear and specific |
| Business problem | What problem were you trying to solve? |
| Dataset | Source and a brief description |
| Data cleaning | Missing values Duplicates Formatting |
| Tools: | Excel, SQL, Python, PowerBI, Tableau |
| Analysis | Queries, calculations and methods. |
| Dashboard | Related charts and KPIs |
| Insights | 3-5 significant findings |
| Recommendations | What should the business do? |
| AI usage | Describe where Gen AI helped |
| Documentation | A short, readable description of the project |
Many beginners forget about documentation.
Your project shouldn’t require a recruiter to open six files to understand what it is.
Simplify the explanation.
Problem. Method. Discussion. Perception. Recommendation.
That’s good.
How many Data Analytics projects should a beginner do?
You don’t need 20 projects.
I’d rather have 3 great projects than 15 basic dashboards copied from tutorials.
Here’s a balanced beginner portfolio to consider:
- Sales Dashboard – Shows BI and Visualisation.
- Customer analysis – shows SQL and analytical thinking.
- AI-enabled business case – demonstrate your modern analytics skills.
Do a fourth project in an industry you actually care about if you have time.
- Health care.
- Financing.
- Consumer.
- Logistics.
- Sports.
- Marketing.
The easier it is to discuss the project in an interview, the better, so pick an industry you’re curious about.
What Skills Should Your Portfolio Show?
A good portfolio for a beginner should showcase different levels of skills in Data Analytics.
Technical skills
You could show:
- Excel
- SQL
- Power BI
- Tableau
- Python
- Panda’s
- Basic statistics
- Cleaned data
- Data visualisation
Business Acumen
Remember:
- Problem-solving
- KPI selection
- Business inquiry
- Trend spotting
- Writing a recommendation
Communication skills:
This is the part that many beginners don’t understand.
Can you sum up a complex result in two sentences?
How do I explain the importance of a specific KPI?
Can you show your dashboard to somebody who doesn’t know SQL?
Those skills can work wonders for your portfolio.
Data Analytics Portfolio or Certification: Which is More Important?
| Factor | Portfolio | Certification |
| Shows practical work | High | Moderate |
| Demonstrates business problem solving | High | Varies |
| Structured learning is | Moderate | High |
| Provides talking points for interviews | High | Medium |
| Tool usage | High | Depends on the program |
| Helps beginners get credibility | High | High |
Ideally, don’t think of them as either/or.
A Data Analytics Certification with Gen AI may signify structured learning and a portfolio will give you evidence of applying those skills.
That combination is especially helpful for career changers and new graduates.
An Online Data Analytics Course with Gen AI may also serve as a structured environment for those who don’t know how to move from tutorials to complete projects.
H2K Infosys now says its program is for beginners and emphasises practical learning, live projects and skills in AI-enabled analytics.
What Can a Strong Portfolio Support? Career Results
A good portfolio isn’t going to get you a job.
That is worth saying loud and clear.
But it can give you something useful in the hiring process: clues.
Instead of saying to an interviewer:
“I’m familiar with Power BI.”
You could say:
Power BI Retail sales dashboard, discovered a category was declining in margin and recommended a change in the product mix.
That’s a much better conversation starter.
Depending on your background, portfolio projects can be used for applications for roles such as:
- Data Junior Analyst
- Analyst, Data
- Business Analysis
- Senior Analyst, Reporting
- BI Specialist
- Market Research Analyst (3)
- Operations Analyst.
H2K Infosys combines its training methodology with career-oriented support including mentoring, resume preparation, interview preparation and job placement assistance, according to its current program information.
Still, consider view placement assistance as help — not a replacement for developing your own skills and applying them consistently.
How Much Do Data Analysts Make In 2026?
Pay varies enormously depending on your location, your experience, your industry and your employer, so you should never think of a portfolio as a direct guarantee of salary.
According to Salary.com, the average Data Analyst salary was $97,717/year as of July 1, 2026, and the 25th–75th percentile range was roughly $87,374–$107,612. Glassdoor’s June 2026 data puts the U.S. average at around $93,347, underscoring why salary estimates should be viewed as market benchmarks, not promises.
The more useful question for beginners is not simply “What salary can I earn?”
Ask:
“How do I show I have the evidence that I’m ready to contribute?”
This is where a great portfolio pays off.
A Simple Formula for a Beginner’s Data Analytics Portfolio
Are you feeling overwhelmed with too many options? Use this formula:
- Project 1: Dash Board
- Project 2: SQL + customer / business analysis
- Project 3: Analysis in Python
- Project 4: Case study focused on the industry
- Project 5: Gen AI supported analytics project
You don’t have to do all five things at once.”
Begin with one.
finish it off properly.
Then build the next one.
This is way less stressful than downloading random datasets every weekend and never finishing anything.
FAQs on a Data Analytics Portfolio for Beginners
What does a beginner Data Analytics portfolio look like?
A beginner portfolio should ideally include 3-5 practical projects covering data cleaning, SQL, visualisation, dashboards, business analysis and increasingly, responsible use of Generative AI.
How many Data Analytics projects are enough for a fresher?
Three strong projects can be enough to make a credible starting portfolio. Emphasise depth, documentation and business rationale over quantity.
Can H2K Infosys assist freshers in developing data analytics skills?
H2K Infosys’ Data Analytics with Gen AI program currently features live instruction, hands-on projects and tools like SQL, Power BI, Tableau and Python, in addition to Generative AI topics. It also has career orientated support in its program.
What is the best project for a starter Data Analytics portfolio?
A sales dashboard is a great starting point as it allows you to showcase data cleaning, KPI creation, SQL or Excel analysis, visualisation and business recommendations all in one project.
Conclusion
A solid entry-level data analytics portfolio: not a bunch of pretty dashboards. It’s evidence that you can do an ambiguous business question, work with imperfect data, find something meaningful and explain what should happen next.
That’s the difference between demonstrating a tool and demonstrating an analytical ability.
If you’re looking for formal training, then H2K Infosys Data Analytics with AI Training can be one way to gain those practical abilities via instructor-led learning, projects and career support. The Generative AI is also part of the learning path in the current H2K Infosys program, following the evolution of the analyst role.
If you are doing a Data Analytics Certification with Gen AI or an Online Data Analytics Course with Gen AI, don’t just leave it at receiving the certificate.