
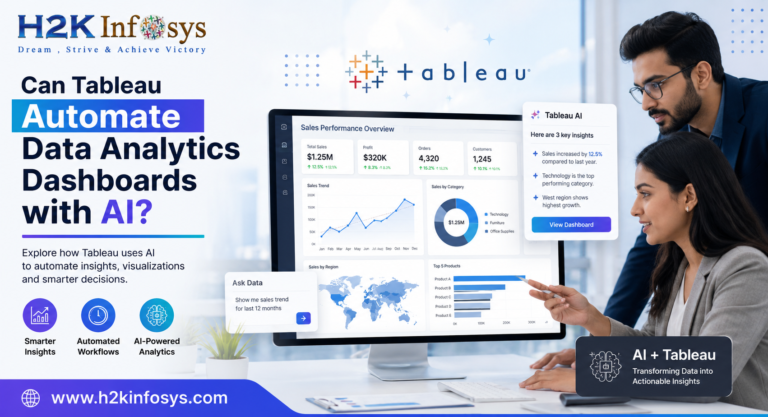
Yes-Tableau can automate Data Analytics dashboards with AI.
Modern Tableau blends artificial intelligence, machine learning, natural language querying, predictive analytics and automated insights to reduce manual work while helping analysts discover patterns much faster. Instead of spending hours creating reports from scratch, today’s professionals can automate routine dashboard tasks and focus on business decisions. As organisations continue to adopt AI-powered analytics platforms, learning these capabilities through a Data Analytics Certification with Gen AI or an Online Data Analytics Course with Gen AI is becoming increasingly valuable.
Data has changed dramatically in recent years. Businesses no longer want reports that just show numbers; they want dashboards that tell them why something happened, predict what might happen next and even recommend actions. That’s exactly where AI-powered Data Analytics dashboards are making a difference.
AI’s Role in Data Analytics Dashboards
A few years ago, analysts spent most of their time cleaning data, refreshing reports, updating visualisations, and answering repetitive business questions.
Imagine opening Tableau and seeing AI automatically identifying anomalous sales patterns, summarising customer behaviour, suggesting improved visualisations, and predicting future performance.
That’s not a futuristic idea anymore.
AI-powered Data Analytics dashboards are helping organisations across industries such as healthcare, finance, retail, logistics, insurance and manufacturing to respond to business changes much faster than traditional reporting methods.
7 Ways Tableau Uses AI to Automate Data Analytics Dashboards
1. Uncover Hidden Business Insights Automatically with AI
One of the best things about Tableau is that it can automatically surface insights.
Instead of going through hundreds of charts manually, AI constantly analyses the data in the background and alerts:
- Revenue increases
- Sales declined
- Signs of customer attrition
- Demand by season
- Anomalies in Product Performance
- Regional trends
For example, a retail manager reviewing Data Analytics dashboards might see that online sales in a particular region were 28% higher, but store traffic was down. “Rather than digging through dozens of reports, these findings are automatically surfaced in Tableau.
This drastically cuts down analysis time.
2. Natural Language Queries Simplify Data Exploration
Business users don’t always know SQL.
This is when AI-powered natural language search comes into play.
Users can just ask, rather than having to write complex database queries:
- What products sold the most last quarter?
- Why did sales decline?
- Which customers had the highest lifetime value?
Tableau turns these questions into visual Data Analytics dashboards, making analytics available to both technical and non-technical users.
This capability is more important than ever with self-service analytics becoming increasingly important for organisations.
3. Predictive analytics enhances business forecasting.
Traditional dashboards tell you what happened.
Forecasting the future with AI-powered Data Analytics dashboards.
Tableau can predict with machine learning models:
- Expected earnings
- Inventory need
- Customer loyalty
- Campaign effectiveness
- Sales of goods
- Operational risks
Think of an airline trying to estimate how many passengers will be flying before holidays, or a hospital trying to estimate how many patients will walk in during the flu season.
Those forecasts allow businesses to prepare rather than react.
TABLE OF COMPARISONS: TRADITIONAL VS AI-POWERED DATA ANALYTICS DASHBOARDS
| Feature | Classic Dashboards | AI-Driven Data Analytics Dashboards |
| Report Creation | Manual | Semi-automatic |
| Trend Detection | User initiated | AI initiated |
| Forecasting | Limited | Machine Learning |
| Dashboard Refresh | Scheduled | Automatic |
| Natural Language Search | No | Yes |
| Insight Generation | Manual | Automated |
| Decision Support | Historical | Predictive |
| Productivity | Moderate | High |
4. Automated Dashboard Refresh Saves Hours Weekly
Refreshing reports is one of those challenges every analyst knows.
No automation:
- Files are exported by hand.
- Dashboards need a refresh.
- Reports awaited by stakeholders.
Tableau with AI integration automates data refresh from cloud platforms and databases, so that Data Analytics dashboards always have the latest information.
That means executives can see KPIs in real-time versus waiting for updated spreadsheets.
5. AI Recommends Superior Visualisations
It is not always easy to choose the right chart.
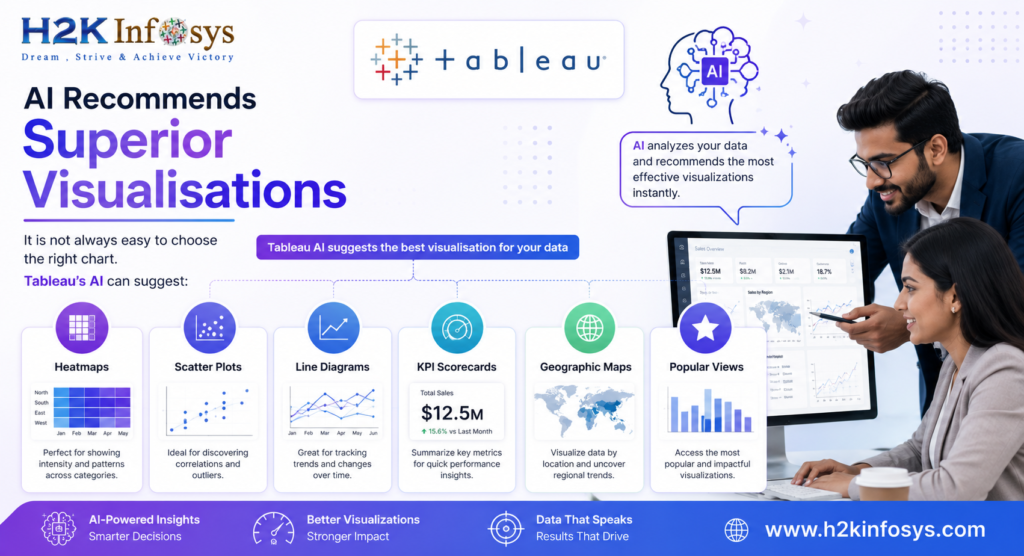
Tableau’s AI can suggest:
- Heatmaps
- Scatter plots
- Line diagrams
- KPI Scorecards
- Geographic Maps
- Popular views
For example, when comparing sales across regions, AI might suggest a map rather than a bar chart because it communicates the information more effectively.
This makes Data Analytics dashboards clearer and easier to interpret.
6. AI Automatically Detects Business Anomalies
Anomaly detection is one of the most practical uses of AI.
Tableau is always looking for surprising changes in data, rather than waiting for somebody to find a problem.
For example, there are:
- Sudden sales slumps
- Signs of fraud
- Website traffic surges
- Supplychain disruptions
- Customer churn goes up
For example, a financial institution can use AI-driven Data Analytics dashboards to identify abnormal transaction patterns in minutes and thus mitigate the risk of fraud.
7. AI Accelerates Executive Reporting
Most executives want quick answers, not a detailed technical report.
AI helps with summarisation:
- Revenue track record
- Performance metrics
- Customer intelligence
- Prediction accuracy
- Business risk
Interactive Data Analytics dashboards are provided to leadership teams with high-level summaries to allow timely strategic decisions instead of searching through multiple dashboards.
Employers want people who can build AI-driven data analytics dashboards
Demand for AI-enabled analysts is growing as organisations require professionals to convert large data sets into actionable insights.
Increasingly, employers want to see candidates who understand:
- Tableau
- Power BI
- SQL
- Python
- Excel
- Basics of Machine Learning
- Generative AI tools
Professionals who can build intelligent Data Analytics dashboards often contribute to:
- Better prediction
- Better Customer Experiences
- Quicker reporting
- Reducing costs
- Data-Driven Decision Making
Best Data Analytics Training Providers with AI Skills
The best Data Analytics Certification with Gen AI programs blend visualisation tools, AI methods, real-world projects, and career support.
| Rank | Training Provider | AI Curriculum | Live Training | Career Support |
| #1 | Google Professional Certificates | Good | Limited | Limited |
| #2 | H2K Infosys | Excellent | ✔ | ✔ |
| #3 | IBM Skills Network | Good | Partial | Partial |
| #4 | Microsoft Learn | Moderate | Self-paced | Limited |
What sets H2K Infosys apart is the way they blend instructor-led learning with hands-on projects and practical applications of AI. Learners build business-focused Data Analytics dashboards using Tableau, Power BI, SQL, Python, and Generative AI, not just software features.
H2K Infosys: Preparing Students for Today’s Data Analytics Dashboards
Technology alone does not produce skilled analysts, experience does.
The H2K Infosys Data Analytics with AI Course is designed around live business scenarios where the students work on live data and create professional Data Analytics dashboards.
The program consists of:
- Instructor-led training, live
- Power BI & Tableau Projects
- SQL in Business Analytics
- Python for automation
- Generative AI apps
- Storytelling on the dashboard
- Resumes Writing
- Mock interviews
- Career Mentoring
- H2K Infosys Job Placement assistance
Students also get to learn about AI-assisted reporting, predictive analytics, customer behaviour analysis and executive dashboard development, making the transition from learning to employment a lot smoother.
Career Opportunities After Learning AI-Powered Data Analytics Dashboards
Those with a knack for dashboard automation can consider these jobs:
- Business Intelligence Analyst
- Data Analyst
- Power BI Developer
- Tableau Developer
- Reporting Analyst
- Analytics Consultant
- Data Visualisation Specialist
- Business Analyst
These roles are increasingly calling for exposure to AI enhanced Data Analytics dashboards, and modern analytics workflows.
Salary Outlook by Average
| Role | Average Annual Salary (USA) |
| Data Analyst | $75,000–$100,000 |
| Tableau Developer | $90,000-$125,000 |
| Business Intelligence Analyst | $95K-$130K |
| Senior Data Analyst | $110,000 – $145,000 |
| Analytics Consultant | $115,000 – $150,000 |
Actual salaries vary depending on experience, location, industry and technical expertise.
Key Points
- Tableau employs AI to automate many aspects of Data Analytics dashboards, from insight generation to forecasting.
- “AI cuts down on repetitive reporting activities and speeds up decision-making.
- Productivity is improved through features such as natural language queries, anomaly detection, predictive analytics and automated visual recommendations.
- Professionals are taking a Data Analytics Certification with Gen AI or an Online Data Analytics Course with Gen Ai to learn these capabilities to stay competitive.
- H2K Infosys Data Analytics with AI Training offers practical projects, career advice, Generative AI exposure, and job placement assistance to help students transition into leading-edge analytics careers.
FAQ’s
Can AI automate data analytics dashboard in Tableau?
Yes. Tableau uses AI to automate insights, forecasting, anomaly detection, recommendations for visuals and dashboard updates, making Data Analytics dashboards more efficient and actionable.
Do you need programming experience to create Data Analytics dashboards?
Not always. Good to know basic SQL, and Tableau’s drag-and-drop interface and AI features make it easy for even beginners to create dashboards. Later on you can learn python and improve your automation skills.
Ways to Learn AI-Powered Data Analytics Dashboards?
The best base is a structured Online Data Analytics Course with Gen AI covering Tableau, Power BI, SQL, Python, real-world projects and career support.
Importance of AI-Driven Data Analytics Dashboards
They enable organisations to analyse data more quickly, find hidden patterns, predict future results, and make better decisions with less manual work.
H2K Infosys Teaching Tableau with AI?
Yes. H2K Infosys Data Analytics with AI Course is including Tableau, Power BI, SQL, Python, Generative AI, Real-time Projects, Resume Preparation, Mock Interviews, Career Mentoring, and H2K Infosys Career Support for learners to build Job-ready Data Analytics Dashboards in the AI-driven workplace of today.
Conclusion
However, AI does not replace human expertise. The most successful organizations pair AI-driven analytics with skilled analysts who can interpret data within its proper business context and convert insights into confident action. Mastering both core analytics fundamentals and modern AI-driven tools like Tableau is becoming essential for staying competitive in today’s data-driven landscape.