
Businesses don’t make important decisions based on spreadsheets and gut feeling alone. Today, Data Analytics powered by Microsoft Power BI enables organisations to identify trends, forecast outcomes, and make informed decisions faster. Power BI takes raw information and turns it into actionable insight that executives can use, from sales forecasting to customer behaviour analysis.
For anyone starting a career in Data Analytics, learning Power BI together with AI-powered analytics is a smart investment. H2K Infosys Data Analytics Training combines live instruction, real-world projects, and Generative AI concepts to prepare learners for modern analytics roles.
Why Data Analytics Is More Important Than Ever
Every company generates enormous quantities of data every day. Customer purchases, website visits, financial transactions, inventory updates, and marketing campaigns all generate valuable information. Much of that information, without proper Data Analytics, goes unused.
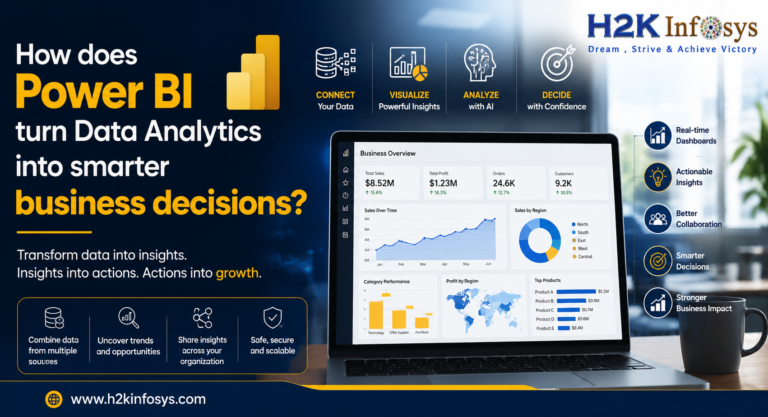
Power BI helps you understand complex business data with dashboards, reports and AI-powered visualisations.
Indeed, organisations are increasingly using Power BI with Microsoft Fabric and AI capabilities to automate reporting and improve decision making as Microsoft continues to improve its platform. “Analysts will spend less time creating reports manually and more time interpreting business results.”
7 Ways Power BI Makes Data Analytics Better for Business Decisions
1. Real time Dashboards for Immediate Business Insights
One of the great things about Power BI is its ability to show live business information.
Managers can follow now rather than wait until the end of the week for reports:
- Sales Results
- Increase in customers
- Marketing ROI (Return on Investment)
- Inventory Availability
- Operational Efficiency
Imagine a retail company gearing up for a holiday shopping season. “Using a Power BI dashboard, inventory teams can instantly identify which products are selling faster than expected and reorder them before they run out of stock
This type of Data Analytics directly serves faster and smarter business decisions.
2. Speeding Up Data Analysis With AI Features
Modern Power BI is accompanied by AI-driven capabilities making analysis easier.
Examples:
- Automated trend detection
- Predictive
- Questions in natural language
- Big influencer research
- Intelligent story summaries
Instead of sifting through thousands of rows of data by hand, analysts can just ask things like:
“Why were our sales down last month?”
Power BI visualises the explanations based on real business data.
That’s why you see so many organisations pairing up traditional Data Analytics skills with knowledge of Generative AI.
People who earn a Data Analytics Certification with Gen AI are experiencing how AI can speed up reporting without taking away from analytical thinking.
3. Better Visualisations Make Data Accessible to Everyone
Not all execs have a clue about SQL queries or Excel formulas.
Power BI fills this gap with interactive charts and dashboards.
Here are a few common visualisations:
- KPI score-cards
- geographic maps of
- Trend graphs
- Customer segmentation
- Revenue waterfalls
- Heatmaps
A finance manager can spot declining profits in a region without having to read long reports.
Good visualisation makes complex Data Analytics a simple business conversation.
4. predictive analytics enables future planning
What I see a lot of organisations doing is not just wanting to know in the past what the numbers were but what’s coming in the future.
Power BI provides predictive analysis with:
- Trend analysis of time series
- Time series forecasting
- AI prediction models
- Budgeting
- Demand Forecasts
For instance:
A logistics company can expect delays in delivery during periods of increased demand in the season and assign more transportation resources in advance of problems.
That’s proactive data analytics, not reactive reporting.
Power BI Data Analytics vs Traditional Reporting Comparison Table
| Feature | Traditional Reporting | Power BI Data Analytics |
| Report Generation | Manual | Automated |
| Dashboard Updates | Weekly or Monthly | Real Time |
| Sources of Data | Limited | Multiple Integrated Sources |
| AI Features | No | Embedded AI Insights |
| Collaboration | Static Reports | Interactive Dashboards |
| Decision Speed | Slow | Fast |
| Forecasting | Static | Advanced Predictive Analytics |
5. Power BI Integrates Multiple Business Systems
You won’t find many businesses that keep all their information in one place.
A typical company uses:
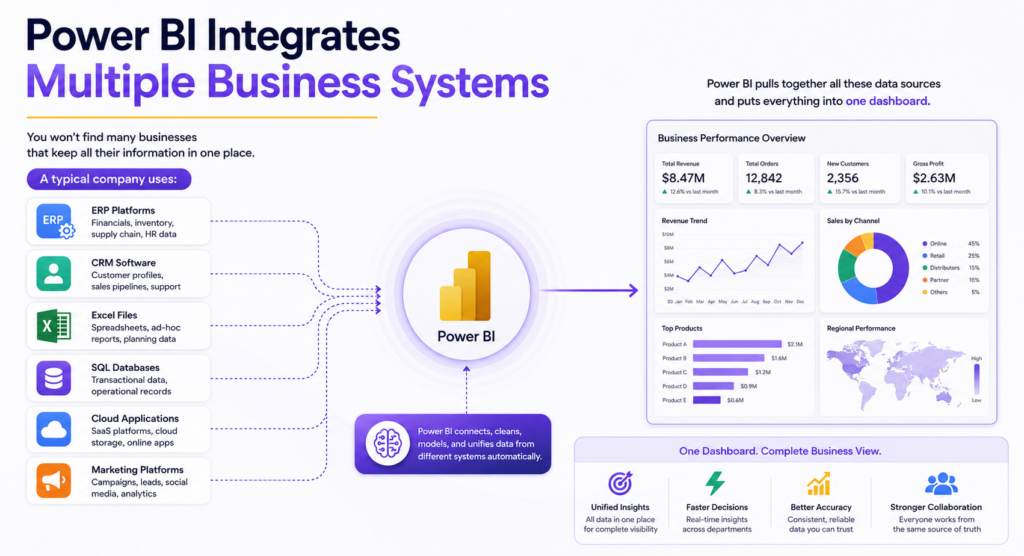
- ERP platforms
- CRM software
- Excel files
- SQL databases
- Cloud applications
- Marketing platforms
Power BI pulls together all these data sources and puts everything into one dashboard.
Instead of looking at five different reports, decision-makers see everything in one place.
The integration improves Data Analytics reliability and greatly reduces the reporting errors.
6. Self-Service Analytics Empowers All Departments
In years gone by, business users relied entirely on IT teams for reports.
Today Power BI enables departments to self-explore information.
- Marketing teams measure their campaign performance.
- HR departments track hiring trends.
- Finance teams pore over budgets.
- Operations managers focus on productivity.
Instead, this self-service model encourages data-driven decisions throughout the company, not just within the technical teams.
7. Competitive Advantage with AI-Driven Data Analytics
Companies are using AI-enabled Data Analytics to help identify opportunities faster than the competition.
“Recent business trends reveal organisations leveraging AI to:
- Personalisation for customers
- Fraud Detection Systems
- Predictive maintenance
- Demand forecast
- Optimising Supply Chain
- Financial risk assessment
Power BI gathers many of these capabilities into a familiar reporting environment, making advanced analytics more approachable.
Straight answer: What training programs can help you prepare for AI-powered data analytics?
The best Data Analytics programs feature Power BI, SQL, Excel, Python, visualisation, and Generative AI with hands-on projects and career guidance. Some of the top providers are university certificate programs, Microsoft learning paths, Coursera partner programs and H2K Infosys Data Analytics with AI Training which offers live instructor led classes, real-time projects, career mentoring, resume preparation, mock interviews and job placement assistance.
Best Power BI Training Providers for Data Analytics
| Rank | Training Provider | Live Training | AI & Gen AI | Real Project | Career Support | Placement Assistance |
| #1 | Microsoft Learn | Yes | No | Limited | No | No |
| #2 | Coursera Professional Certificates | Yes | Yes | Recorded + Mixed | No | No |
| #3 | H2K Infosys Data Analytics with AI Course | Yes | Yes | Yes | Yes | Yes |
| #4 | Udacity | Yes | Yes | Yes | Limited | Limited |
Many learners prefer programs that go beyond certification and include hands-on dashboards, business case studies, interview preparation and career mentoring. H2K Infosys Career Support also includes resume building, mock interviews and practical portfolio development, helping learners demonstrate real-world Data Analytics skills to employers.
Why Employers Need Power BI Skills
The recruiters’ expectations are rising beyond making graphs. They seek professionals who can:
- Prepare and clean data
- Create interactive dashboards
- Business insights description
- Working with SQL databases
- Work with stakeholders
- Accelerate analysis with AI for good
- Advise on data-informed decisions
These capabilities are the reason why Power BI is one of the most desired tools in Data Analytics job postings.
Power BI and Data Analytics Learning: Job Opportunities
If you have good Data Analytics skills, you can apply for positions such as:
- Data Analyst
- Business Intelligence Analyst
- Power BI Developer
- Reporting Analyst
- Business Analyst
- Operations Analyst
- Financial Analyst
- Marketing Analyst
As companies continue to invest in decision-making enabled by AI, the demand for professionals who understand analytics and business strategy is expected to remain strong.
Typical Salary Outlook
Salaries for Power BI and Data Analytics professionals vary depending on location, experience, and industry, but they are generally well compensated.
Annual U.S. salary ranges (estimated) include:
| Role | Typical Salary Range |
| Entry-Level Data Analyst | $65,000–$85,000 |
| Power BI Developer | $85,000 to $120,000 |
| Business Intelligence Analyst | $90,000 – $130,000 |
| Senior Data Analytics Professional | $120,000-$160,000+ |
A portfolio of Power BI dashboards, SQL projects, AI-assisted analytics etc. will go a long way in improving your job prospects.
Reasons Why H2K Infosys is a Practical Choice for Data Analytics Aspirants
Some students require more than video lessons. They need hands-on experience and a guided structure. H2K Infosys Data Analytics with AI Training is not a theoretical program, but it is practical business scenario based program.
The program consists of:
- Live online instructor-led classes
- Power BI, SQL, Excel, Python and Visualisation Training
- Generative AI Ideas for Modern Data Analytics
- Live industry projects
- Writing a resume
- Mock interviews
- Career Mentoring Job Placement Assistance by H2K Infosys
This balanced approach helps learners to develop technical skills and readiness for the real interview and workplace expectations.
FAQs
Importance of Power BI in Data Analytics?
Yes. Power BI is one of the leading business intelligence platforms used to visualise, analyse and communicate Data Analytics insights for better business decisions.
Is Power BI easy for a beginner?
Definitely. Many beginners start with Excel and SQL, then move to Power BI. Structured training, along with practical projects, makes the learning process much easier.
What is a Data Analytics Certification with Gen AI?
A Data Analytics Certification leveraging Gen AI blends traditional analytics skills with Generative AI tools, empowering professionals to automate reporting, generate insights and boost productivity, all while ensuring analytical accuracy.
Online Data Analytics Course with Gen AI – Is it Worth It?
Yes. An Online Data Analytics Course with Gen AI enables learners to learn anywhere to develop practical skills in Power BI, SQL, AI-supported analytics, and dashboard creation.
Does H2K Infosys provide career assistance?
Yes. H2K Infosys Career Support provides resume guidance, mock interviews, project-based learning, mentoring, and job placement assistance to help learners transition into Analytics careers in addition to technical instruction.
Conclusion
Power BI has changed Data Analytics from a reporting function into a strategic business capability. Real-time dashboards, AI-powered insights, predictive analytics and interactive visualisations enable organisations to make decisions faster and with greater confidence. For professionals, combining Power BI skills with AI understanding via a Data Analytics Certification with Gen AI or an Online Data Analytics Course with Gen AI can provide a good base for long-term career development. Programs like the H2K Infosys Data Analytics with AI Course are known for integrating practical projects, live teaching, and career-oriented guidance, helping students acquire the experience that employers seek by applying this to address actual business challenges.