


In the data visualization field, Tableau is the leading platform used by several data experts. It makes data visualization so powerful and easy to understand for everyone, including the non-technical background people. It provides more formulas, fields, calculations, and simple visualization tools and methods to provide an intuitive user interface. However, many people face a problem once they start applying the more features of Tableau.
We are at a faster pace world where even a millisecond matters a lot, and the delay by some seconds can cause the loss of audience. So, the performance of your Tableau matters a lot. But how can anyone make Tableau run faster and provide the results instantly? In this article, we are listing out the common things which slow down the performance and the solution for the same.
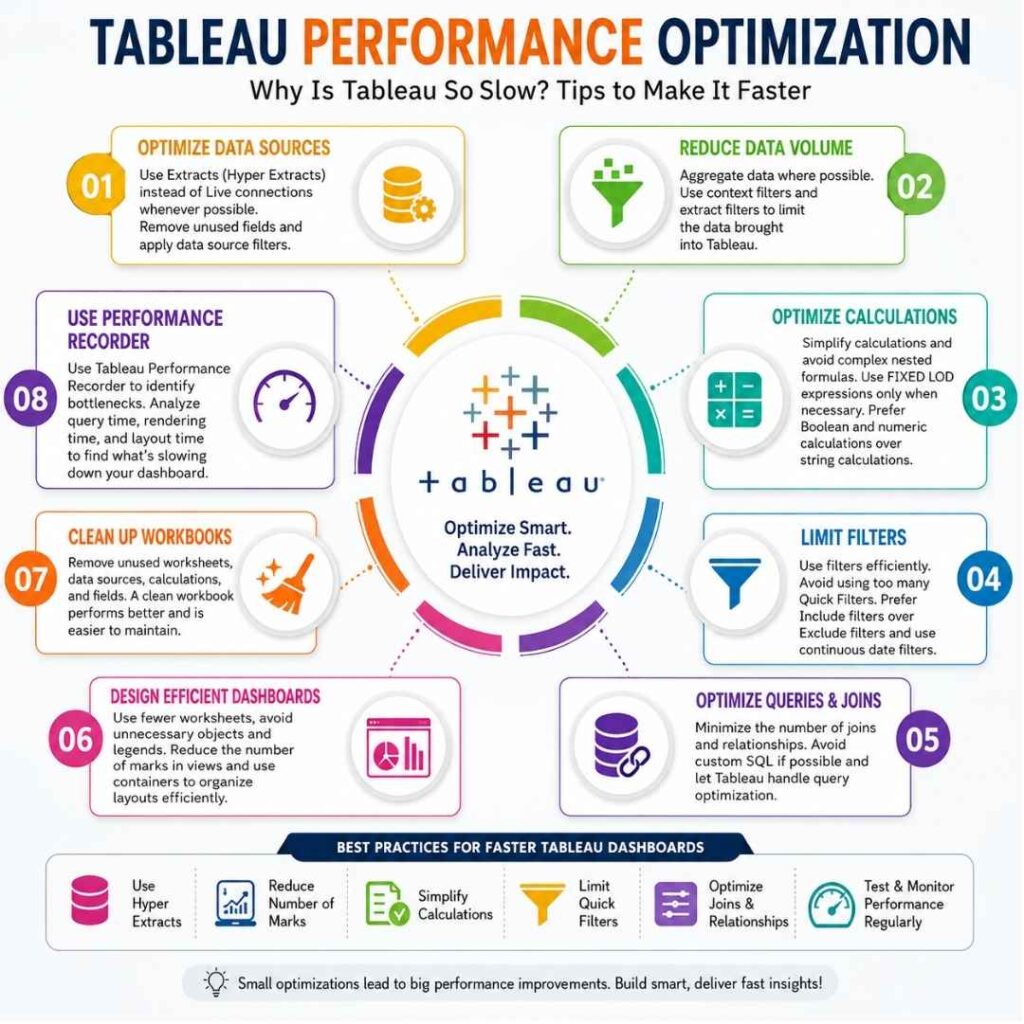
The data strategy affects performance.
The data strategy, such as live data or extracted data, decides the performance speed. Generally, working with extracted information is much faster than the live data. The extracted data is excellent for prototyping works. Also, the more comprehensive your data source and data set, you can expect the more delay in the execution time. Hence, deciding the best way for data analysis (live or extract based) is critical for increasing performance.
You can enhance the performance by minimizing the number of fields used in your dashboard. To achieve the greater execution speed, you need to do the ‘Hide All Unsued Fields’ option to remove all unused columns from the data source. You can get to know all the useful techniques and features by enrolling in the best tableau training classes. By using the extract filters, you can keep only the data you need. However, the extracts are not the long term solution since the extracts are not real-time data.
Decrease the data points in your view
The more marks are bound to create more batches, making the processing speed slow. Excessive marks also reduce the visual analytics value of your dashboard. You can eliminate these issues by practicing guided analysis and deleting unnecessary detail shelf.
materialize and optimize calculations
Wherever possible, you need to perform the calculations in the database to increase the execution speed. Aggregate calculations do wonder for calculated fields. Also, performing low-level calculations in the database helps to achieve your goal. If you use more marks in your view, the execution takes more time. The calculations using the MIN or MAX functions help quicken the processing time rather than using the AVG function and making the groups with calculations also a better way to increase the speed.
Another great tip to remember is the more you use numeric or booleans calculations instead of string calculations, the your dashboards take less time. If you choose the best tableau training classes online, you can know more about all these things.
Limit your filters
Filters feature is the powerful and expressive feature of Tableau. But the same can cause performance issues if it is used excessively and inefficiently. This is the primary cause of your dashboard’s slowness. Hence, you can minimize the number of filter usage from your dashboard. Go through all of your filters and remove the excess filters for better performance results. Also, if you use exclude filters, they load the whole domain of a dimension. You can get rid of this issue by using the include filter. To take advantage of indexing properties, you need to use the continuous date filter.
Use query optimization
If you use more members in your blend, it takes a longer time to execute any operation. Similarly, the usage of lots of joints takes more time and affects the performance of your dashboards. Hence, minimize the joints and see the excellent performance. If your data connection uses custom SQL, the execution of any process takes more time. So, you can eliminate custom SQL and take advantage of Tableau’s database optimizations.
Clean up
The multiple numbers of worksheets on your dashboard lower your Tableau performance in a big way. So, make sure to use fewer worksheets in your dashboards. You can consolidate or delete the unnecessary and unused worksheets and data sources to improve its performance. Always remember a clean workbook is easier to work, and it provides the results instantly.
Why Is Tableau So Slow?
Slow Tableau dashboards are usually caused by large datasets, complex calculations, too many filters, inefficient data sources, or poorly designed dashboards. When multiple worksheets, live database connections, and high-cardinality dimensions are combined, Tableau has to process more information before displaying results. Understanding the root cause is the first step in Tableau Performance Optimization. Instead of focusing on a single fix, optimize your data source, calculations, filters, and dashboard layout together for the best results.
Use Tableau Performance Recorder
One of the easiest ways to identify performance bottlenecks is by using Tableau’s Performance Recorder. This built-in feature records every action performed while interacting with a workbook and shows how much time is spent on query execution, rendering, layout, and calculations.
To use it:
- Open Help → Settings and Performance → Start Performance Recording.
- Interact with your dashboard normally.
- Stop the recording.
- Tableau generates a performance workbook showing where delays occur.
The Performance Recorder helps you determine whether the issue is caused by your database, calculations, dashboard design, or visual rendering. It is one of the most effective tools for Tableau Performance Optimization.
Optimize Your Dashboard Design
A well-designed dashboard loads faster and provides a better user experience. Avoid placing too many charts, worksheets, filters, and legends on a single dashboard. Instead, focus on displaying only the information users need.
Some best practices include:
- Reduce the number of worksheets.
- Remove unused legends and objects.
- Use containers to organize layouts efficiently.
- Avoid unnecessary formatting and background images.
- Display fewer marks whenever possible.
Simple dashboards are easier to maintain and perform much better.
Optimize Your Data Source
The way your data is stored has a significant impact on Tableau performance. If possible, use Hyper Extracts instead of live connections for analytical dashboards. Hyper Extracts are optimized for fast query execution and often provide much better performance.
You should also:
- Remove unused columns.
- Apply extract filters.
- Aggregate data before importing it into Tableau.
- Avoid duplicate records.
- Refresh extracts regularly to keep data current.
A clean and optimized data source reduces query time and improves dashboard responsiveness.
Common Mistakes That Slow Down Tableau
Many performance issues are caused by avoidable mistakes during dashboard development. Some of the most common ones include:
- Using too many Quick Filters.
- Creating excessive calculated fields.
- Using unnecessary joins.
- Loading millions of records without filtering.
- Using complex Custom SQL queries.
- Displaying too many marks in visualizations.
- Keeping unused worksheets and data sources in the workbook.
Avoiding these mistakes can significantly improve dashboard speed.
Tableau Performance Optimization Best Practices
Follow these best practices to build faster and more responsive Tableau dashboards:
- Use Hyper Extracts whenever possible.
- Keep dashboards simple and focused.
- Remove unused fields and worksheets.
- Optimize calculations and reduce nested formulas.
- Minimize Quick Filters.
- Reduce the number of marks in visualizations.
- Optimize joins and relationships.
- Use Tableau Performance Recorder regularly.
- Test dashboard performance with real-world data before publishing.
These practices not only improve speed but also make dashboards easier to maintain.
Conclusion
Tableau Performance Optimization is not about applying a single technique it requires optimizing your data source, calculations, filters, and dashboard design together. Small improvements, such as reducing unnecessary worksheets, using Hyper Extracts, simplifying calculations, and monitoring performance with Tableau Performance Recorder, can make a noticeable difference. As your dashboards grow in complexity, following these best practices will help deliver faster load times, smoother interactions, and a better experience for end users. If you want to master these techniques through hands-on projects and real-world scenarios, consider enrolling in a comprehensive Tableau training program to build practical performance optimization skills.
FAQs:
What is Tableau Performance Optimization?
Tableau Performance Optimization is the process of improving dashboard speed by optimizing data sources, calculations, filters, queries, and dashboard design.
Why does Tableau become slow?
Tableau can become slow due to large datasets, live database connections, complex calculations, excessive filters, and poorly designed dashboards.
Is Tableau Hyper Extract faster than a live connection?
Yes. Hyper Extracts generally provide faster query performance because the data is stored in Tableau’s optimized extract format instead of querying the database for every interaction.
How can I make Tableau dashboards load faster?
Use Hyper Extracts, reduce the number of marks, simplify calculations, optimize filters, remove unused fields, and use Tableau Performance Recorder to identify bottlenecks.
Does removing unused fields improve Tableau performance?
Yes. Removing unused fields reduces the amount of metadata Tableau processes, which can improve workbook performance and simplify dashboard maintenance.
























One Response
Using tableau in a real and professional and midsize heavy data. Tableau Performance is too bad.. to much Hype for this data visualization toys