If you’re already comfortable using Excel and thinking about moving into advanced data analytics tools, here’s the honest, no-fluff answer: don’t start from scratch. Build on what you know, then slowly add tools like SQL, Python, and visualization platforms. That transition when done step by step actually feels a lot less overwhelming than it sounds.
Why Excel Starts Falling Short
Excel is… solid. No doubt about that. Pivot tables, VLOOKUPs, dashboards you can do a lot. I’ve seen entire teams run reporting just on Excel, and for a while, it works perfectly fine.
But then the data grows.
And suddenly things slow down. Files crash. Formulas break for no clear reason. You start double-checking everything because something feels off. That’s usually the point where people realize they’ve outgrown it.
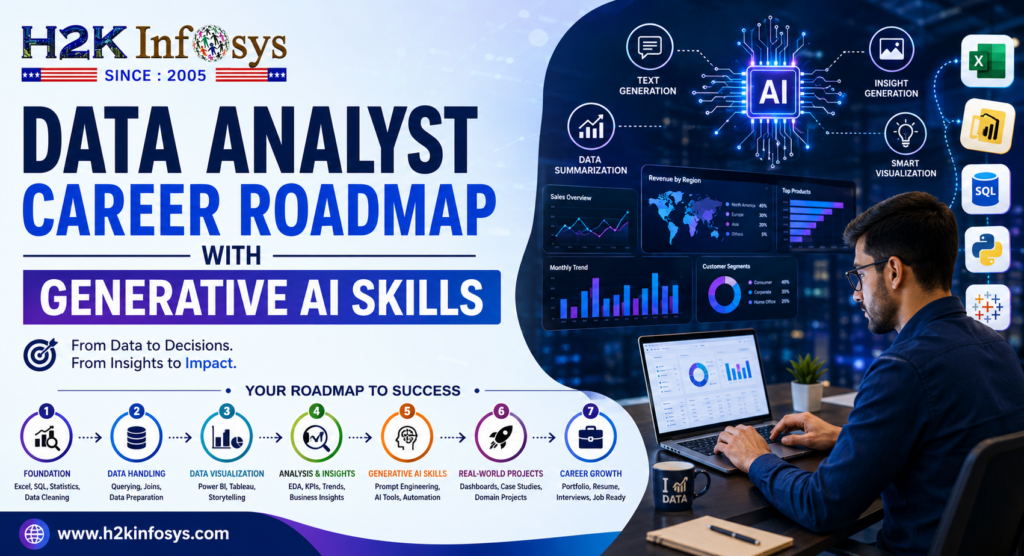
Modern businesses lean heavily on data analytics tools that can handle large datasets without blinking, automate repetitive work, and generate insights almost instantly. Tools like Power BI, Tableau, or Python-based workflows don’t replace Excel they kind of… stretch what you can do with it.
Step 1: Get Really Comfortable With the Basics
Before jumping into new data analytics tools tools, it’s worth tightening your Excel skills a bit more.
Focus on things like:
- INDEX-MATCH or XLOOKUP (seriously, these matter more than people think)
- Cleaning messy data (you’ll do this everywhere, not just in Excel)
- Building simple dashboards
Here’s the thing most data analytics tools follow the same logic you already use in Excel. Just… scaled up.
I remember getting stuck on SQL joins early on. It felt confusing until I realized, “Wait, this is just like merging sheets.” After that, it clicked much faster.
Step 2: SQL – The First Real Shift

If Excel is your base, SQL is the natural next step.
It lets you:
- Pull exactly the data you need
- Work with large datasets without slowing down
- Interact with databases instead of static files
Most employers expect at least basic SQL in any Data Analytics course these days. And honestly, once you get the hang of SELECT, WHERE, and JOIN, you’ll start wondering why you didn’t learn it earlier.
Step 3: Visualization Tools (Where Things Get Fun)
This is usually where people start enjoying the process.
Tools like Power BI or Tableau turn boring spreadsheets into interactive dashboards. Suddenly, you’re not just reporting numbers you’re telling a story with them.
And that matters, because decision-makers don’t want to scroll through Excel sheets. They want clear visuals, trends, and insights they can understand quickly.
Instead of sending a bulky Excel file, imagine sharing a dashboard that shows:
- Sales trends over time
- Customer behavior patterns
- Future forecasts
It’s cleaner. Easier to read. And honestly, it just looks more professional.
Step 4: Python or R
You don’t have to learn Python or R right away. But if you do, it opens up a lot of possibilities.
With Python, you can:
- Automate repetitive tasks (huge time saver)
- Handle massive datasets
- Run predictive analysis
Even basic exposure helps. That’s why many Data Analytics certification programs now include Python it’s becoming hard to ignore in the industry.
Step 5: Real Projects (This Part Gets Overlooked)

Learning tools is one thing. Actually using them? Totally different story.
You need hands-on experience:
- Work with real datasets
- Solve actual business problems
- Build projects from start to finish
For example:
- Analyzing sales trends
- Creating a churn prediction dashboard
- Forecasting revenue
This is usually where structured programs make a difference, because they guide you through real scenarios instead of just theory.
Why Training Helps More Than You Think
Self-learning sounds great and it is, up to a point.
But then you hit a wall. Maybe something doesn’t work. Maybe you don’t know what to learn next.
A good Data Analytics course gives you:
- A clear direction
- Practical projects
- Exposure to relevant data analytics tools
- Some level of mentorship
One name that often comes up in discussions is H2K Infosys. Their training approach focuses a lot on real-time project experience, which honestly makes the shift from Excel to advanced data analytics tools feel more natural and less scattered.
How H2K Infosys Fits Into the Journey
What stands out is the structure.
1. Step-by-step learning
You’re not jumping randomly between tools. You move from basics to advanced data analytics tools in a logical way.
2. Real-world projects
You’re not just watching tutorials you’re actually doing the work.
3. Industry-focused content
Their Data Analytics certification programs are aligned with what companies currently look for, not outdated material.
4. Job-oriented approach
Everything is geared toward helping you become employable, which, let’s be honest, is the main goal for most learners.
Common Struggles (Everyone Has Them)
“There are too many tools. I don’t know where to start.”
Yeah, that’s normal. Just pick one usually SQL and build from there.
“I don’t have a technical background.”
That’s okay. A lot of analysts started with Excel and gradually moved into data analytics tools.
“I keep forgetting what I learn.”
Happens to everyone. The fix is simple: use it. Even small projects help.
A Simple Before-and-After Scenario

Let’s say right now you:
- Track sales in Excel
- Create reports manually every month
After transitioning:
- You pull data using SQL
- Clean and process it with Python
- Build dashboards in Power BI
- Automate reporting
Same job but faster, cleaner, and honestly… a bit more satisfying.
Final Thoughts (Just Being Real Here)
Moving from Excel to advanced data analytics tools isn’t about abandoning what you know. It’s more like upgrading it.
Take it one step at a time. Practice more than you think you need to. Follow a structured Data Analytics training if you feel stuck.
And once you get comfortable with these data analytics tools, going back to Excel-only workflows feels… a little limiting. Not bad just limited.