
Your Data Analytics Career Roadmap: Top 5 Steps
| Rank | Roadmap Stage | Top Skills | Beginner Result |
|---|---|---|---|
| #1 | Build the basics | Excel, statistics, data concepts | Understand and organise data |
| #2 | SQL and databases | SQL, queries, joins, aggregation | Extract useful business data |
| #3 | Guided training | Power BI, Tableau, Python, Gen AI | Build job-ready analytics skills |
| #4 | Build real world projects | Show practical ability | Dashboards, case studies, portfolios |
| #5 | Work readiness | Resume, interviews, communication | Apply for jobs confidently |
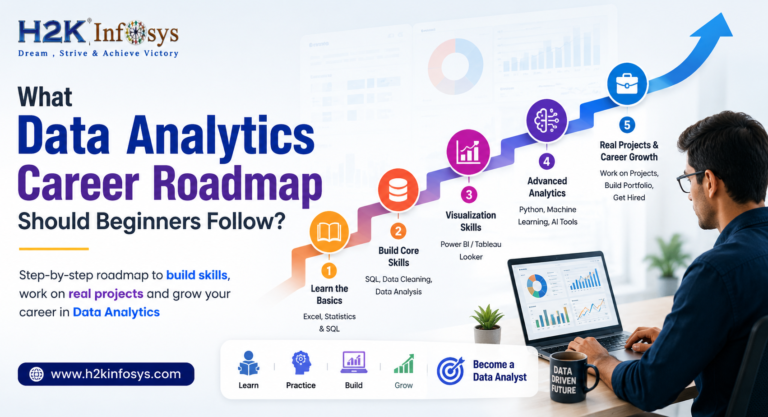
A practical roadmap for Data Analytics career should begin with Excel and statistics, progress to SQL and visualisation, and then incorporate Python, Generative AI, real-world projects, and job preparation. Beginners don’t need to learn all analytics instruments at once. The better way is to build one useful skill at a time and prove it in projects.
The field is also moving fast. Analytical thinking is another core skill. The World Economic Forum’s Future of Jobs Report 2025 lists AI and big data as some of the fastest growing skill areas thru 2030.
Okay, so what should a beginner really learn first?
Here is a roadmap for a practical Data Analytics career in 5 stages.
The point isn’t simply to tick those five boxes. Connecting them results in a strong Data Analytics career.
1. Excel and Statistics: The Data Analytics Career Roadmap Starts Here
Excel is a good starting point for most beginners. It immediately shows how analysts work with rows, columns, formulas, filters, summaries, and business information.
Useful Excel Features to Learn:
- XLOOKUP vs VLOOKUP
- IF and IF Nested
- COUNTIF & SUMIFS
- MATCH-INDEX(
- Pivot table.
- Charts
- Format condition
- Data Cleansing
- Basic dashboards
You should also learn enough statistics that you understand what your numbers are really telling you.
Core Statistical Concepts:
- Average, middle, typical
- %ages
- Standard deviation
- Distributions
- Correlation Data
- Sampled
- Fundamental probability
- Outliers
You don’t have to be a statistician. The idea is to take a data set and ask meaningful questions.
For example, suppose an online retailer wants to know what caused last quarter’s 18% rise in sales. A beginner might simply say the increase. An analyst should ask, What products caused this? What region grew? Did they have more customers or did the customers buy more?
This shift in thinking is one of the first major milestones in a Data Analytics career roadmap.
2. Learn SQL Before You Move Too Far Ahead
Excel teaches you how to work with spreadsheets, SQL teaches you how to work with databases.
SQL should be considered a core skill if you’re serious about a Data Analytics career, not an optional extra.
Core SQL Topics:
- Choose
- WHERE?
- GROUP BY ORDER BY
- GROUP BY
- OWING TO
- CASE expressions
- Total functions
- JOIN
- LEFT OUTER JOIN
- Sub-Queries
- Common Table Expression
- Windowing functions
Make SQL exercises relevant to business questions.
Rather than learning:
- This is how GROUP BY works.
Try:
- What product category generated the most revenue in the last month?”
That little difference makes practice so much more real.
A good exercise is to take a sales database and answer ten business questions with SQL. Then make charts out of them in Power BI or tableau.
That is when the different pieces of your Data Analytics career roadmap begin to fall into place.
3. Structured training on Power BI, Python and Gen AI
The basics are feeling good, and beginners often face a confusing crossroads: Should I learn Python? Power BI ? Tableau? Gen AI? All of it ?
Don’t try to learn everything all at once.
Recommended Learning Sequence:
- Excel
- SQL
- Power BI / Tableau
- Python
- Gen AI
Cleaned data can be used to build interactive dashboards, which Power BI is especially useful for. Modern analytics platforms are also being augmented with generative AI capabilities. For example, Microsoft describes what Copilot can do in Power BI including analysis and DAX generation.
Python can be next, especially for data cleaning, exploratory analysis, automation and more advanced analytics.
Data Analytics Career Roadmap Training Option – H2K Infosys
A beginner at this point can benefit from a structured program to avoid the YouTube tutorial/documentation/disconnected courses shuffle.
Beginners looking for structured analytics learning can check out training provider H2K Infosys. Its approach mixes instructor-led learning with practical exercises around analytical instruments and career preparation.
Learners interested in blending traditional analytics skills with newer AI-assisted workflows might appreciate the H2K Infosys Data Analytics with AI Course. A good Data Analytics Certification with Gen AI should do more than just teach AI terminology; it should show learners how Gen AI fits into real analytics work.
How Artificial Intelligence Supports Data Analytics Career:

- SQL Queries Writing
- data cleaning thoughts
- Creation of formulae
- Dashboard descriptions
- Summary of reports
- Exploratory analysis
- Business question formulation
But there is an important rule: Don’t blindly trust the analysis generated by AI.
An analyst still needs to validate calculations, check assumptions, understand the source data and explain why an insight is important.
It’s that human judgement that’s at the heart of a sustainable Data Analytics career.
Quick Comparison of Learning Choices
| Learning Mode | Ideal For | Hands-on Experience | Career Assistance |
|---|---|---|---|
| Self-learning | High independence in learning | Depends on the learner | Usually limited |
| University programs | Depth of academic study | Often structured | Varies |
| Flexible learning | Online course providers | Varies | Varies by course |
| Bootcamps | Fast learning | Usually project based | Often included |
| H2K Infosys | Structured learning to build your career | Projects and tools practise | Mentoring, resume and interview preparation |
Your choice depends on your budget, schedule, learning style and career objectives. No training provider can substitute consistent practice.
4. Build Real Projects Before Claiming You’re Job-Ready
This is the part where many beginners underestimate the Data Analytics career roadmap.
Completing ten courses is not the same as showing analytical ability.
A portfolio project should demonstrate your ability to take messy information, look into it, and communicate an answer.
Project Ideas to Try:
- Analysis of E-commerce Sales
- Using sales data, identify:
- Top Selling Products
- monthly income
- Customer segments
- Performance by Region
- Patterns of return
- Profit trends
- Build the analysis using SQL and create a Power BI report.
- Using sales data, identify:
- Customer Attrition Analysis
- Look at customer information and find patterns in those that leave.
- You might think about the following:
- Subscription period
- Type of customer
- monthly expenses
- Support interactions
- Using the product
- Then present three or four business recommendations.
- Analysis of Marketing Campaign
- Use the following to track how your campaigns are doing:
- Click-through rate
- ConversionRate
- Price per acquisition
- Income
- Customer acquisition channels
- Use the following to track how your campaigns are doing:
The project does not need to be big. In fact, it is usually easier to discuss a smaller project with a clear business question during an interview.
This also is where an Online Data Analytics Course with Gen AI may be useful, if it teaches the learners how to combine conventional analytics with AI-assisted workflows instead of treating Gen AI as a separate topic.
Questions Every Portfolio Should Answer:
- What was the issue?
- What did you find out?
- What does the business do now?
That’s far more powerful than just showing a colourful dashboard.
5. Complete the Data Analytics Career Roadmap with Job Preparation
The final stage is not really “the end.” It’s the point where your learning turns into a job search.
Typical Entry-Level Positions:
- Data Analyses
- Data Analyst – Junior
- Business Analysis
- Senior Analyst, Reporting
- BI Specialist
- Market Research Analyst (3)
- Business Analyst ( BA)
Resume Optimization
Make sure that your resume is results-oriented, not tool-oriented.
- Don’t: Developed Power BI dashboards.
- Try again: Created an interactive Power BI sales dashboard to monitor monthly revenue, regional performance, and product trends.
The second version gives the hiring manager something specific to talk about.
Prepare for interviews with a focus on SQL, Excel, visualisation, statistics, business scenarios, and behavioural questions.
Career support can also ease the transition. For instance, H2K Infosys provides H2K Infosys Career Support with its technical training, which includes resume preparation and mock interview-oriented preparation.
Another thing that learners need to consider while looking for some structured guidance during the employment phase is H2K Infosys Job Placement support. However, job results are all based on individual skills, experience, location, interview performance and the market.
What Will a Data Analytics Career Look Like in 2026?
The role is becoming more AI-assisted, but that doesn’t mean analysts can stop learning fundamentals.
Skills like AI and big data are projected to be among the fastest growing by 2030, according to the World Economic Forum. It emphasises the importance of analytical thinking, creative thinking, adaptability and lifelong learning.
And that mix is important.
Say an analyst has a dirty customer dataset. Gen AI could generate a SQL query or explain a formula. A BI platform can help you build pieces of a report. But someone has to determine whether the data is trustworthy, whether the metric is relevant, whether the recommendation is good for business.
That is why the best Data Analytics career roadmap is a combination of technical skills with judgement.
How Much Do Entry-Level Data Analytics Jobs Pay?
Salary will depend a lot on country, city, industry, experience, technical skills, and job title. So, beginners should be careful in believing generalised salary promises.
In the United States, very similar analytical occupations can serve as useful benchmarks. For instance, the U.S. Bureau of Labor Statistics reports a May 2024 median annual wage of $91,290 for operations research analysts, with employment projected to grow 21% from 2024 to 2034.
That figure should not be interpreted as a guaranteed Data Analytics salary. “Data analyst” covers a broad collection of roles, and compensation can be considerably different between employers and industries.
A better strategy is to focus first on employable skills and measurable project experience.
A Simple 6-Month Data Analytics Career Roadmap
If you’re starting from zero, here’s one realistic way to structure your learning:
| Month | Focus |
|---|---|
| Month 1 | Excel + data fundamentals |
| Month 2 | Statistics + SQL basics |
| Month 3 | Advanced SQL + Power BI |
| Month 4 | Tableau/Python + data projects |
| Month 5 | Gen AI for analytics + portfolio |
| Month 6 | Resume + mock interviews + job applications |
You can move faster or slower. Someone with an Excel background may progress differently from someone completely new to technology.
The point is consistency.
Common Mistakes Beginners Make
A good Data Analytics career roadmap also includes knowing what not to do.
1. Learning Too Many Tools
Knowing a little Excel, Python, R, Tableau, Power BI, SQL, Spark, and machine learning doesn’t automatically make someone job-ready. Build depth before collecting tools.
2. Ignoring Communication
An analyst who discovers an important trend but cannot explain it clearly will struggle to create business impact.
3. Building Only Tutorial Projects
Following a YouTube tutorial step-by-step is useful practice, but employers want evidence that you can think independently.
4. Treating Gen AI as a Shortcut
Gen AI can speed up certain tasks, but it doesn’t replace validation or analytical reasoning.
5. Applying Without a Portfolio
A well-presented project can give interviewers something concrete to evaluate and discuss.
FAQs About the Data Analytics Career Roadmap
What is the best Data Analytics career roadmap for beginners?
Start with Excel and basic statistics, then learn SQL, Power BI or Tableau, Python, Gen AI, real-world projects, and finally resume and interview preparation.
Is a Data Analytics Certification with Gen AI useful for beginners?
It can be useful when the certification combines fundamental analytics with practical Gen AI applications. Beginners should prioritize hands-on projects and genuine skill development rather than choosing a certification based only on its title.
Should I take an Online Data Analytics Course with Gen AI?
An Online Data Analytics Course with Gen AI can be a practical option for learners who need flexible instruction and want exposure to both traditional analytics and AI-assisted workflows. Compare curriculum, projects, instructor support, and career services before enrolling.
Can I start a Data Analytics career without a computer science degree?
Yes. Many analytics skills are learnable outside a computer science degree. However, employers can still have different education requirements, so check the qualifications listed for the roles you want.
Final Thoughts
A strong Data Analytics career roadmap is not about racing through every tool you can find. It is about building a reliable foundation, practicing on realistic problems, learning how to communicate insights, and gradually adding AI capabilities.
Start with Excel and statistics. Move to SQL and visualization. Add Python and Gen AI when the fundamentals are comfortable. Then build projects that resemble actual business work.
For learners who prefer structured instruction, providers such as H2K Infosys can offer a guided path through analytics tools, projects, AI-focused learning, and career preparation. Its H2K Infosys Data Analytics with AI Training can be considered alongside other learning options rather than as a substitute for independent practice.
The biggest advantage in a Data Analytics career is not knowing the most tools. It’s being able to take a messy question, work through the data, find something meaningful, and explain what should happen next.