


If you are into Data Analysis as a Business Analyst, it’s crucial to study and comprehend the concept of data analysis. In order to find relevant information, come to conclusions, and help decision-making, it entails the analysis, cleaning, transformation, and modelling of data. Let’s use a store as an example. You have a lot of sales data.
Data Analysis as a Business Analyst would entail looking at the data to determine which items are selling the most, which ones are well-liked by particular demographics, or if there are any particular reasons influencing sales.
You may decide what things to carry, how to price them, and which clients to target by analysing the data. To learn more, you can check out the online business analyst course.
Types of Data Analysis as a Business Analyst
Depending on the goals and type of the data being analysed, many approaches and methodologies are included in data analysis. Here are a few typical categories of data analysis: Data Analysis as a Business Analyst
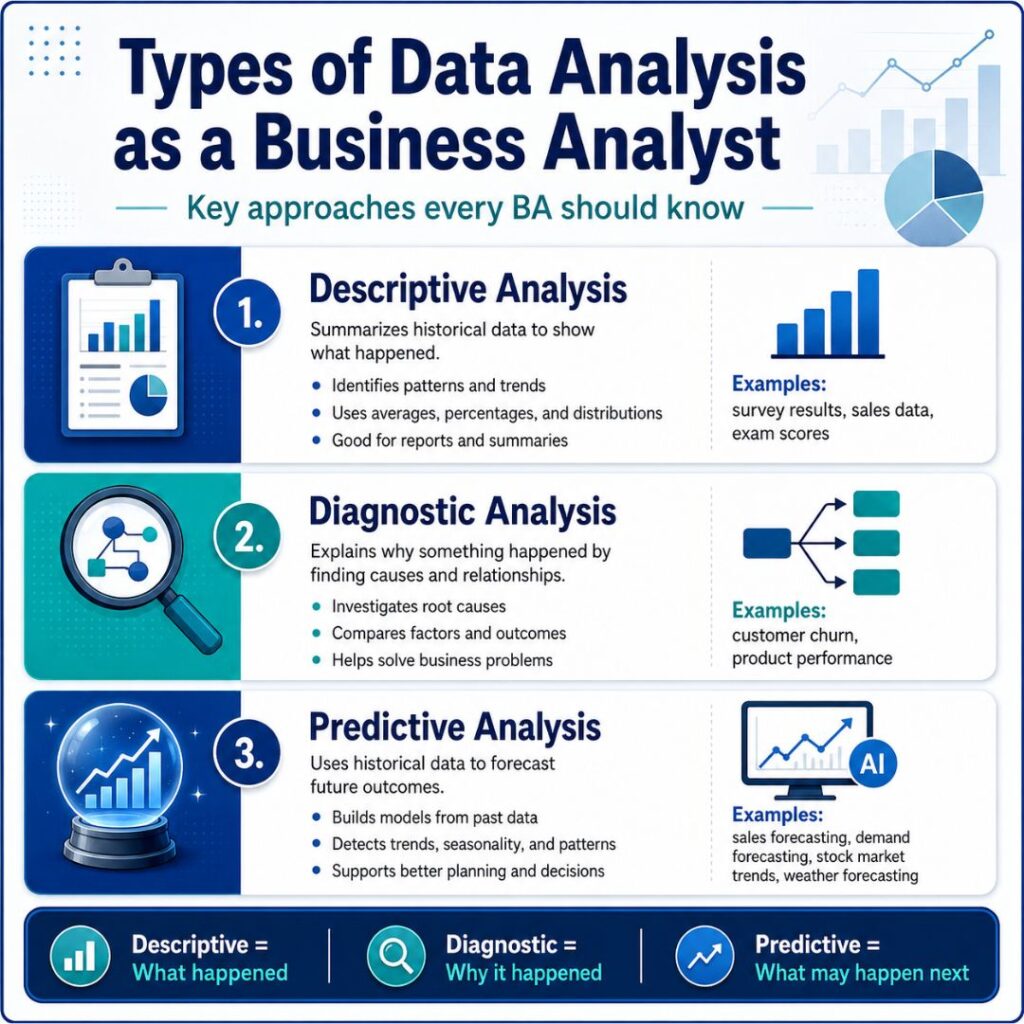
1. Descriptive analysis
A fundamental kind of Data Analysis as a Business Analyst called descriptive analysis seeks to summarise and present facts in a comprehensible and educational way. Descriptive analysis offers insights into the traits and patterns found in the data by calculating various statistics.
Here are some illustrations of descriptive analysis methods:
- Survey Results: Assume you asked your students about their preferred pastimes in order to compile a list of their responses. Once the replies have been gathered, you can utilise descriptive analysis to compile the information. You may determine what proportion of your peers love various pastimes, such as sports, films, reading, and outdoor activities. You would get a general idea of the preferences in your class from this.
- Sales Data: Let’s say you run a modest internet business and want to examine your sales information. You can compute the average daily sales, the most popular products, or the distribution of sales among various customer segments by using descriptive analysis. You can use this information to better understand your target market and popular products as well as peak sales periods.
- Exam Scores: If you’re a student, you can utilise descriptive analysis to comprehend how you did in various classes. You could figure out the average score, the range of scores, and the proportion of students who scored higher than a particular mark, for instance. Your strengths and weaknesses would be revealed by this study, allowing you to concentrate on the areas that need improvement.
2. Diagnostic analysis
You can utilise diagnostic analysis, a potent method, to comprehend the cause-and-effect connections in a dataset. In addition to descriptive analysis, it focuses on examining patterns and trends in order to pinpoint the variables that influence particular outcomes or behaviours.
In order to help you understand better, consider these examples:
- Customer Churn: Consider that you work for a telecommunications Data Analysis as a Business Analyst and want to know why some customers are churning. You can investigate a number of variables, including client demographics, service usage patterns, pricing, and customer satisfaction levels, by performing a diagnostic analysis. You may find that customers with longer contract durations and poorer customer satisfaction are more likely to churn by looking at these criteria and how they relate to churn. This knowledge will enable the business to take proactive steps to raise customer happiness and lower turnover.
- Product Performance: Diagnostic analysis can also be used to judge how well a product or service is performing. Imagine you work for an online retailer and want to find out why some products receive better customer reviews than others. You can find trends and pinpoint the primary factors that influence customer satisfaction by studying customer evaluations, product features, pricing, and delivery schedules. According to this data, products with quicker delivery dates, affordable prices, and favourable customer reviews typically have higher ratings. With this information, you can improve product selections and marketing tactics to raise total client contentment and revenue.
3. Predictive analysis
Predictive analysis, as the name suggests, uses historical Data Analysis as a Business Analyst to create models and forecast future results.
In order to estimate future trends, this entails using machine learning to uncover patterns and relationships from historical data.
For instance, you can anticipate future sales in sales forecasting using variables like advertising spending, seasonality, and economic indicators.
To create precise forecasts, predictive analysis takes into account elements including trends, seasonality, and cyclical patterns. It is frequently utilised in many industries, including banking, stock market analysis, demand forecasting, and weather forecasting.
How to start a Data Analysis as a Business Analyst career
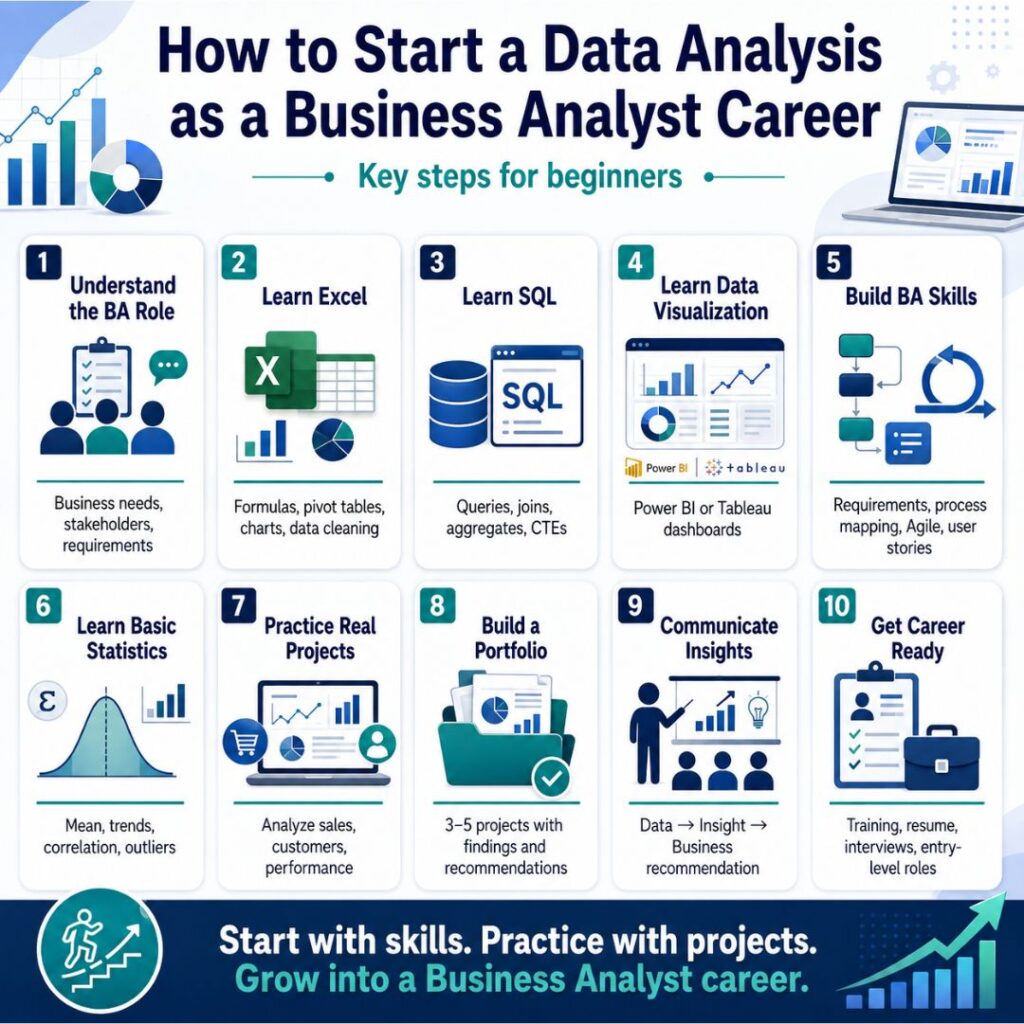
Starting a Data Analysis as a Business Analyst career requires a combination of business knowledge, analytical skills, and practical experience. You do not need to become a full-time data scientist. Instead, focus on learning how to use data to identify business problems, uncover trends, support decisions, and communicate insights to stakeholders.
1. Understand the Role of a Business Analyst
Before learning data analysis tools, understand how a Business Analyst works. A BA typically works between business stakeholders and technical teams to identify requirements, analyze processes, and recommend solutions.
When Data Analysis as a Business Analyst is added to the role, you may also be expected to:
- Analyze business and customer data
- Identify trends and patterns
- Create reports and dashboards
- Measure business performance
- Find opportunities for improvement
- Support data-driven decisions
- Present insights to stakeholders
This combination makes Data Analysis as a Business Analyst a valuable skill for Business Analysts.
2. Build a Strong Foundation in Excel
Excel is one of the most useful starting points for learning data analysis. It helps you understand how data is organized and how basic analysis works.
Focus on:
- VLOOKUP/XLOOKUP
- IF and nested IF functions
- SUMIF/SUMIFS and COUNTIF/COUNTIFS
- Pivot Tables
- Charts and graphs
- Conditional formatting
- Data cleaning
- Basic statistical functions
For example, you could analyze monthly sales data to determine which products generate the highest revenue or which regions are underperforming.
3. Learn SQL for Data Analysis
Once you are comfortable with Excel, learn SQL. Business Analysts frequently work with databases, so knowing how to retrieve and analyze data can be a major advantage.
Start with:
- SELECT
- WHERE
- ORDER BY
- GROUP BY
- HAVING
- JOINs
- CASE statements
- Aggregate functions
- Subqueries
- Common Table Expressions (CTEs)
- Window functions
For example, instead of asking a technical team to provide a report, a Business Analyst with SQL skills can query the database to investigate customer behavior, sales performance, or product usage.
4. Learn Data Visualization
Analyzing data is only part of the job. You also need to communicate what the data means.
Learn a visualization tool such as Power BI or Tableau.
Practice creating dashboards that show:
- Revenue trends
- Customer growth
- Sales performance
- Customer retention
- Product performance
- Key performance indicators (KPIs)
The important skill is not simply creating attractive charts. You should be able to explain why a particular metric changed and what the business should do about it.
5. Develop Business Analysis Skills
Technical skills alone are not enough for a Business Analyst career. You also need strong BA fundamentals.
Learn:
- Requirements gathering
- Stakeholder management
- Business process analysis
- Functional and non-functional requirements
- BRD and FRD documentation
- Use cases
- User stories
- Acceptance criteria
- Process mapping
- Agile and Scrum
- Root-cause analysis
For example, if sales have declined, a Business Analyst should not simply report the decrease. They should investigate possible causes, analyze relevant data, speak with stakeholders, and recommend appropriate actions.
6. Learn Basic Statistics
You do not need advanced mathematics to begin, but basic statistics will help you interpret data correctly.
Start with:
- Mean, median, and mode
- Percentage and percentage change
- Standard deviation
- Distribution
- Correlation
- Outliers
- Sampling
- Trends
Understanding these concepts helps you avoid drawing incorrect conclusions from business data.
7. Practice With Real-World Projects
Projects are one of the best ways to turn theoretical knowledge into practical experience.
For example, create a sales analysis project where you:
- Collect a dataset.
- Clean the data using Excel or another tool.
- Store or query the data using SQL.
- Analyze sales trends.
- Identify underperforming products.
- Build a Power BI or Tableau dashboard.
- Write your business recommendations.
- Present your findings as if you were reporting to a client.
This demonstrates both Data Analysis as a Business Analyst thinking.
8. Build a Portfolio
A portfolio can help demonstrate your practical skills to employers.
Consider creating 3–5 projects covering different business scenarios, such as:
- Sales performance analysis
- Customer churn analysis
- E-commerce analysis
- Marketing campaign analysis
- Employee performance analysis
For each project, explain the business problem, data used, analysis performed, key findings, and recommended business actions.
9. Learn to Communicate Insights
A good Business Analyst does more than produce numbers.
You should be able to turn:
Data → Insight → Business Recommendation
For example:
Sales decreased by 15% in one region during the last quarter.
A stronger analysis would investigate:
- Which products were affected?
- Which customer segments changed?
- Did pricing change?
- Did competitors introduce new offers?
- Did customer traffic decline?
- What action could improve performance?
This is where Data Analysis as a Business Analyst comes together.
10. Consider Formal Training
If you are a beginner, structured Data Analysis as a Business Analyst training can provide a more organized learning path. Look for programs that combine Business Analysis fundamentals with practical tools such as Excel, SQL, Power BI/Tableau, Agile, requirements analysis, and real-time projects.
For example, training programs from providers such as H2K Infosys can be considered if you are looking for instructor-led learning, practical projects, career mentoring, resume preparation, mock interviews, and placement assistance.
11. Apply for Entry-Level Roles
Once you have the fundamentals and a few projects, start applying for roles such as:
- Junior Business Analyst
- Business Analyst
- Data Analyst
- Business Data Analyst
- Reporting Analyst
- BI Analyst
- Operations Analyst
Your first role does not necessarily need to have “Data Analyst” in the title. Many Business Analyst positions involve significant amounts of reporting, SQL, dashboarding, and data-driven decision-making.
Benefits of Data Analysis as a Business Analyst
- Better decision-making: Use data to support business decisions with facts instead of assumptions.
- Stronger problem-solving: Identify trends, patterns, and potential business issues more effectively.
- Improved business insights: Understand customer behavior, sales performance, and business processes.
- Better stakeholder communication: Present clear findings through reports, dashboards, and visualizations.
- More career opportunities: Data Analysis as a Business Analyst skills can help you move into data-focused and BI-related roles.
- Higher productivity: Tools such as Excel, SQL, and Power BI can make analysis and reporting faster.
Conclusion
You can learn more about Data Analysis as a Business Analyst by checking out the business analysis training.
Starting a Data Analysis as a Business Analyst career is easier when you build your skills step by step. Focus on Business Analysis fundamentals, Excel, SQL, and data visualization tools such as Power BI or Tableau. Most importantly, practice with real-world projects and learn how to turn data into actionable business insights. With the right combination of technical and analytical skills, you can confidently move toward Business Analyst and data-focused roles.
FAQs: Data Analysis as a Business Analyst career
1. Can a Business Analyst become a Data Analyst?
Yes. Business Analysts who develop skills in SQL, Excel, statistics, and data visualization can transition into Data Analyst roles.
2. What data analysis skills should a Business Analyst learn?
Start with Excel, SQL, data visualization, basic statistics, and data interpretation. These skills complement core Business Analysis knowledge.
3. Is SQL necessary for a Business Analyst?
SQL is not required for every BA role, but it is a valuable skill, especially for positions involving databases, reporting, and data analysis.
4. Which tool is best for data visualization?
Power BI and Tableau are both widely used. Beginners can start with either one and learn how to build dashboards, track KPIs, and present insights.
5. How can I gain practical experience in data analysis?
Work on real-world projects involving sales, customers, finance, or operations. Analyze the data, identify trends, create dashboards, and provide business recommendations.