

Business data analytics has become an important part of modern business decision-making. Organizations use data to understand customer behavior, measure performance, identify market trends, improve operations, and make more informed strategic decisions. For business analysts, understanding how to collect, interpret, and communicate data is increasingly valuable because many business problems can be solved more effectively when decisions are supported by reliable evidence.
H2K Infosys provides Business Analyst training for learners who want to develop practical knowledge of business analysis concepts, tools, and data-driven decision-making. Learning business data analytics can help aspiring and working business analysts strengthen their ability to evaluate business problems, track key performance indicators, and provide useful recommendations to stakeholders.
What Is Business Data Analytics?
Business data analytics is the process of collecting, organizing, analyzing, and interpreting business data to discover patterns, measure performance, and support better decisions. The data may come from sales systems, customer relationship management platforms, websites, financial records, surveys, supply chain systems, and other business applications.
The main objective of business data analytics is to transform raw data into meaningful insights. These insights can help organizations understand what happened, identify why it happened, predict what may happen next, and determine what actions may improve business outcomes. Business analysts can use these findings to evaluate processes, identify performance gaps, monitor KPIs, and support evidence-based recommendations.
Types of Business Data Analytics
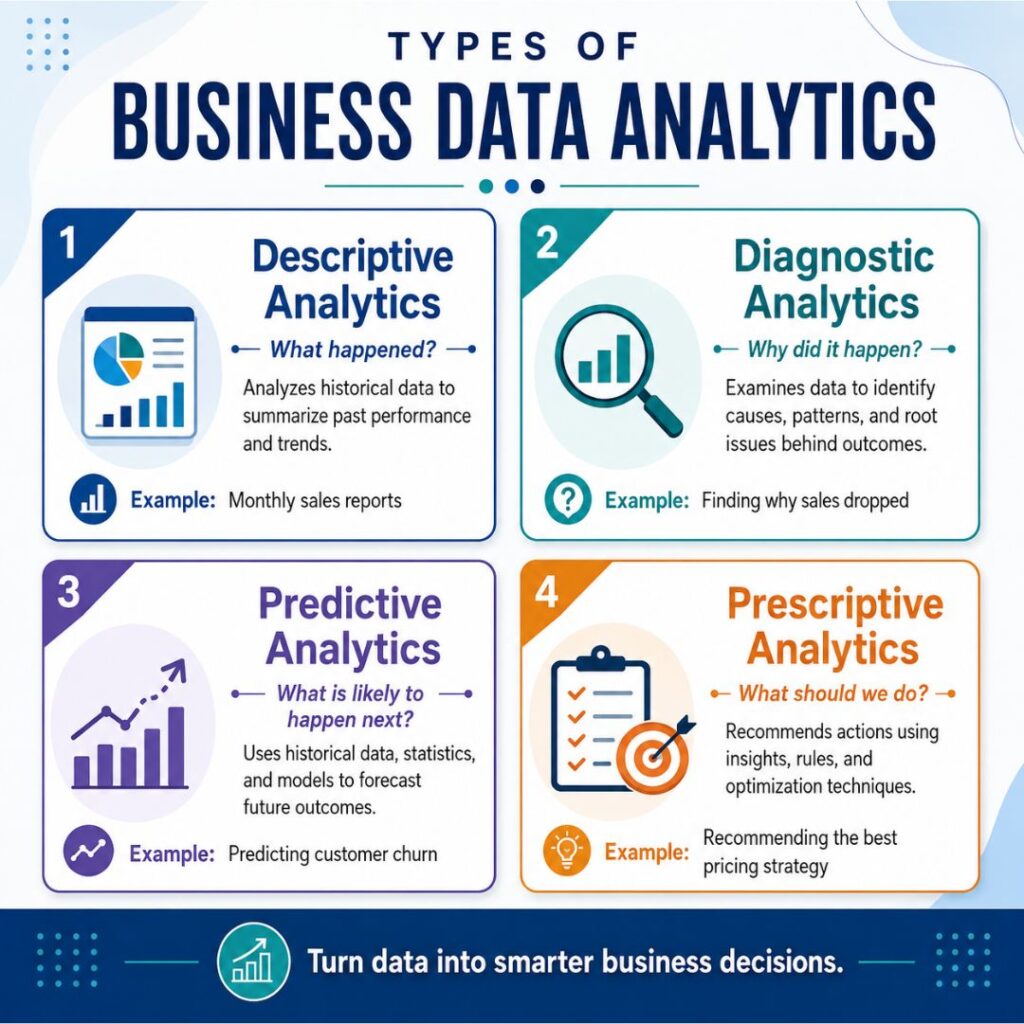
Business data analytics is commonly divided into four main types. Each type helps organizations answer a different business question.
1. Descriptive Analytics
Descriptive analytics explains what happened by summarizing historical data. Businesses use it to review sales, website traffic, customer activity, revenue, and other performance metrics.
For example, a retailer may use descriptive analytics to identify that online sales declined during the previous quarter.
2. Diagnostic Analytics
Diagnostic analytics explains why something happened. It uses techniques such as root cause analysis, segmentation, correlation analysis, and comparisons to identify factors behind a result.
For example, a company may discover that sales declined because website traffic decreased or more customers abandoned their shopping carts.
3. Predictive Analytics
Predictive analytics answers what is likely to happen next. It uses historical data, statistical models, and sometimes machine learning to forecast future results.
Businesses use predictive analytics for sales forecasting, customer churn prediction, demand planning, risk analysis, and inventory management.
4. Prescriptive Analytics
Prescriptive analytics focuses on what action should be taken. It combines data, predictions, business rules, and optimization techniques to recommend possible decisions.
For example, a company may use prescriptive analytics to determine suitable inventory levels, allocate marketing budgets, or recommend products to customers.
Business Data Analytics Process
A business data analytics project usually follows a series of steps that turn raw information into useful business insights.
Step 1: Define the Business Problem
The first step is to identify the question the organization wants to answer. Examples include why customers are leaving, why sales are declining, or which marketing campaign performs best.
Step 2: Collect Relevant Data
Data may come from CRM systems, ERP platforms, sales databases, websites, surveys, financial systems, customer support tools, and other business applications.
Step 3: Clean and Prepare the Data
Raw data often contains duplicates, missing values, errors, or inconsistent formats. Data cleaning improves accuracy by correcting these problems. The information may also need to be combined, categorized, or transformed before analysis.
Step 4: Analyze the Data
Analysts use methods such as descriptive statistics, trend analysis, correlation, regression, segmentation, and forecasting to identify patterns and relationships.
Step 5: Visualize and Interpret Results
Charts, dashboards, and reports make analytical findings easier to understand. Analysts then interpret the results in the context of the business problem and communicate the most important insights to stakeholders.
Step 6: Take Action and Monitor Results
Businesses can use the insights to make changes and then monitor KPIs to determine whether those actions produced the expected results.
How Business Analysts Use Data Analytics
Data analytics is an important skill for business analysts because it helps them support recommendations with evidence instead of assumptions.
Business analysts may use analytics to:
- Identify business performance trends
- Define and monitor KPIs
- Analyze customer behavior
- Evaluate business processes
- Detect operational inefficiencies
- Create dashboards and reports
- Support forecasting and planning
- Measure the impact of proposed solutions
- Present data-driven recommendations to stakeholders
For example, a business analyst working with an e-commerce company could examine conversion rates, abandoned carts, customer complaints, and purchasing behavior to identify problems in the checkout process.
Popular Business Data Analytics Tools
Different tools are used depending on the type and complexity of the analysis.
Microsoft Excel: Commonly used for calculations, data cleaning, PivotTables, charts, and reporting.
SQL: Used to retrieve, filter, combine, and analyze data stored in relational databases.
Power BI: Helps users create dashboards, monitor KPIs, visualize trends, and share business reports.
Tableau: A popular visualization platform used to create interactive dashboards and reports.
Python: Useful for advanced data analysis, automation, statistical modelling, and machine learning.
Business Data Analytics Examples
Business data analytics can be used across many departments and industries.
Retail: Analyze sales and purchasing patterns to forecast demand and improve inventory management.
Marketing: Evaluate website traffic, advertising campaigns, conversion rates, and customer acquisition costs.
Finance: Support forecasting, risk analysis, customer segmentation, and fraud detection.
Supply Chain: Analyze supplier performance, delivery times, inventory levels, and demand trends.
Customer Service: Review support tickets, customer feedback, response times, and satisfaction scores to identify common problems.
Challenges of Business Data Analytics
Business analytics also involves several challenges. Poor-quality or incomplete data can lead to inaccurate conclusions, while data stored across separate systems may be difficult to combine.
Organizations must also consider data privacy and security, employee analytical skills, and the risk of misinterpreting results. Historical data can contain bias, and correlation between two variables does not always mean that one caused the other.
The biggest challenge is often turning insights into action. Analytics is most valuable when findings lead to measurable improvements in business performance.
Conclusion
Business data analytics helps organizations transform raw information into useful insights for better decision-making. By collecting reliable data, analyzing it with suitable methods, and interpreting the findings in a business context, companies can improve efficiency, understand customers, reduce risk, and identify new opportunities.
For business analysts, skills in tools such as Excel, SQL, Power BI, and Tableau can strengthen their ability to evaluate problems, communicate insights, and recommend practical business solutions.
FAQs
What are the four types of business analytics?
The four main types are descriptive, diagnostic, predictive, and prescriptive analytics. They help businesses understand what happened, why it happened, what may happen next, and what action should be taken.
What tools do business analysts use for data analytics?
Common tools include Excel, SQL, Power BI, Tableau, and Python. The tools required depend on the organization, role, and complexity of the data.
Why is data analytics important for business analysts?
Data analytics helps business analysts identify problems, evaluate performance, measure KPIs, validate assumptions, and provide evidence-based recommendations.
Is business data analytics difficult to learn?
Business data analytics can be learned step by step. Beginners can start with Excel, basic statistics, and data visualization before moving to tools such as SQL, Power BI, Tableau, or Python.
What skills are needed for business data analytics?
Important skills include analytical thinking, problem-solving, data interpretation, Excel, SQL, data visualization, communication, and a basic understanding of business processes.